

AL Circle analysis: Germany’s aluminium trade surplus, Novelis’ US expansion, Asia’s EV demand & India’s underutilised downstream capacity
Aluminium’s next growth phase is increasingly being shaped by downstream processing, supply-chain resilience and demand from specialised applications. Germany continues to generate a substantial trade surplus in flat-rolled products despite a shrinking primary aluminium base, while North America is investing in recycling and rolling. Across Asia, new manufacturing capabilities and growing demand from electric vehicles, railways and batteries are creating further opportunities. However, declining exports, underutilised capacity and uneven profitability show that investment alone does not guarantee success. For industry leaders, the challenge is to identify where demand is shifting, develop products that meet customer requirements and ensure that new investments translate into sustainable...
AL Circle Analysis: From Guinea to Gulf, how bauxite, tariffs and logistics redraw aluminium map
Aluminium markets in late 2026 are being shaped by more than the headline LME aluminium price. Bauxite security, alumina availability, geopolitical disruptions, tariff negotiations, logistics diversification and regional premiums are increasingly determining where metal moves and what buyers pay. From RUSAL reassessing Caribbean assets and Vedanta securing Odisha bauxite to Brazil extending mine life and EGA rebuilding its Guinea supply chain, producers are strengthening control over critical raw materials. At the same time, the US remains heavily dependent on imported bauxite and alumina, while Europe and Asia are experiencing sharply different premium dynamics. These developments point to a market where physical availability is becoming a regional factor even as aluminium itself remains...
Grow with
AL Circle

Delving deeper: Middle East aluminium crisis rattles domestic and global downstream supply chains
Over the years, the Middle East has been a notable contributor to the global primary aluminium production and trade. Out of the 6-6.5 million tonnes produced in the region, 5-5.5 million tonnes are exported, underlining the lion’s share of the production being shipped overseas. This share accounts for about 9 per cent of the total primary aluminium trade volume in the global market. However, it is interesting to note that the Middle Eastern region, particularly the Gulf Cooperation Council, also contributes to the trade and export of aluminium downstream products. Discover: The Gulf aluminium market risks, China impact, and logistics disruptions shaping pricing and trade in the Gulf Disruption Roadmap Uday Patel, Principal Analyst at Wood Mackenzie, noted, “What this disruption highlights...

Aluminium scrap imports drop 16% y-o-y in Q1CY'26. Will India face tighter supplies in Q2?
India's aluminium scrap imports declined by 16 per cent Y-o-Y to 0.35 tonnes in Q1CY'26, down from 0.42 tonnes in the corresponding period last year. The country remains heavily dependent on imports, with nearly 85 per cent of its aluminium scrap requirement sourced from overseas. As a result, the decline in arrivals has had a direct impact on domestic secondary producers, who rely on a consistent inflow of scrap to sustain production. The downturn has been driven by a combination of volatile LME prices, constrained global supply, and currency pressures, which have elevated landed costs and weakened fresh booking activity. This situation has been further aggravated by escalating geopolitical tensions in the Middle East, which have disrupted key trade flows, increased freight and insurance...

Mozal shutdown exposes Africa’s aluminium production vulnerability as Q1 2026 output falls 6.2%
Africa’s aluminium sector entered 2026 facing a difficult question: how exposed has the continent’s supply chain become to power disruptions and concentrated production risks? The concern intensified after regional aluminium production declined to 381,000 tonnes in Q1 2026, marking a 6.2 per cent drop from 406,000 tonnes in Q4 2025 and a 3.3 per cent Y-o-Y decline compared with 394,000 tonnes in Q1 2025. The decline exposed how dependent Africa’s aluminium chain remains on concentrated production hubs, fragile electricity systems and climate-sensitive infrastructure. Africa’s aluminium output looked stable through 2025 - so what changed? For much of 2025, Africa’s aluminium production remained relatively balanced. Output increased from 394,000 tonnes in Q1 2025 to 407,000 tonnes in Q2,...

What happens to aluminium when supply, energy and carbon collide: A market simultaneously facing scarcity, costs and power risks
The global primary aluminium industry has entered 2026 with a very different market condition from the one that defined the past decade. What was once a story of supply abundance, Chinese expansion and cyclical price swings is now turning into one of scarcity, geopolitical fragmentation and carbon-driven trade barriers. At the same time, emerging supply hubs such as Indonesia and Guinea are grappling with resource protection, infrastructure tailbacks and rising power needs, while supply shocks in Mozambique, Iceland and the downstream sector are constraining the market further. China’s 45 million tonne ceiling has become the market’s hard limit One of the heaviest and most impactful events in the global aluminium market is the enforcement of China’s 45 million tonne primary aluminium...

China May gasoline demand to contract over 10% Y-o-Y
China's daily gasoline consumption in May is projected to fall over 10 per cent compared with the same period last year, partly due to high prices constraining the downstream demand, aside sustained substitution of electric vehicles, according to OilChem's data. In detail, China's gasoline demand is estimated at around 390.300 tonnes per day in May, rising 6.56 per cent from April but down 10.71 per cent from last May, based on OilChem's analysis. Entering May, the gas stations have launched sales promotions on the backdrop of sound retail margins, easing the constraints on the demand end caused by high prices. However, the May demand is likely to contract over 10 per cent compared with last year, a far more significant year-on-year decline than a normal level of around 5 per cent,...

China’s aluminium exports jump 15% in April amid Gulf turmoil, but can it replace GCC supply?
As tensions in the Middle East continue to disrupt one of the world’s most critical trade corridors, global aluminium buyers are turning towards China in search of supply stability. But while China’s exports are accelerating rapidly, the bigger question remains - can the country truly offset the growing supply risks emerging from the Gulf region? The changing trade pattern is becoming increasingly evident across major markets including India, Mexico, United States, Vietnam and South Korea, where importers are ramping up purchases from China amid concerns over freight uncertainty, tighter supply availability and potential disruptions to Gulf-linked shipments. China shipments jump amid Gulf uncertainty China’s exports of unwrought aluminium and aluminium products climbed sharply in April...

Scaling sustainability: Beverage cans in Africa’s fragmented market
In the global shift towards more sustainable packaging, aluminium beverage cans are often positioned as a near-ideal solution – infinitely recyclable, lightweight, and increasingly favoured by brands seeking both environmental credibility and shelf appeal. In Africa, however, their growth tells a more complex story. Demand is rising, but unevenly, shaped by competing realities: aspiration and affordability, formal industry and informal systems, global ambition and local constraint. Demand for aluminium cans is growing across the continent, though not in the same way as in Europe or North America. Here, the transition remains uneven, unfolding against structural and economic limits. Iris Arsic, the features editor of The Metal Packager, speaks with Chukwuma Ndigwe, recycling team lead at...

India: Aluminium prices rise w-o-w on firm MCX and LME trends
Domestic aluminium prices in India increased w-o-w as of 7 May 2026, supported by firmer trends on the London Metal Exchange (LME) and the Multi Commodity Exchange of India (MCX). As per market assessments, P1020 ingot prices in Delhi NCR rose by INR 4,500 per tonne, or 1.2 per cent, W-o-W to INR 375,000 per tonne on 7 May. Similarly, Mumbai prices increased by INR 3,000 per tonne, or 0.8 per cent, W-o-W to INR 374,000 per tonne during the same period. How did Indian and global exchanges perform? Domestic aluminium futures on the Multi Commodity Exchange of India increased W-o-W by INR 4,080 per tonne, or 1.1 per cent, to INR 369,080 per tonne, indicating improved momentum in the domestic market despite intra-week volatility. For forward-thinking aluminium market insights amidst supply...

China’s aluminium overcapacity may become the hidden stabiliser of its renewable power grid
For more than a decade, the phrase “industrial overcapacity” has been shorthand for possible inefficiency in China’s heavy industries — too many smelters, too much idle infrastructure, too much capital trapped in sectors that Beijing has repeatedly tried to rationalise. Aluminium has often sat at the centre of that debate because of its enormous electricity appetite and its strategic importance to manufacturing, transport, defence and energy transition technologies. But a new research is challenging that entire narrative. Instead of treating overcapacity as a burden, the study argues that China’s surplus aluminium-smelting capacity could become a critical flexibility tool for a renewable-heavy electricity system. Excess smelting capacity may function as a seasonal balancing mechanism for...

Global alumina production drops 6.1% in Q1 2026 as major markets retreat Q-o-Q, while North America moves against the trend
Global metallurgical-grade alumina production lost momentum in Q1 2026 after several key producing regions scaled back from the exceptionally strong output levels seen at the end of 2025, with North America emerging as the only region to register quarter-on-quarter growth, albeit marginally. China underwent widespread refinery maintenance and environmental shutdowns, Asia & Africa normalised after aggressive year-end production pushes, while Europe and Oceania continued battling energy pressures, maintenance activity and operational disruptions. These combined factors pulled global alumina production down 6.1 per cent quarter-on-quarter to 35.4 million tonnes in Q1 2026 from 37.7 million tonnes in Q4 2025. However, compared with Q1 2025, worldwide output remained broadly stable, rising...

Indian auto acceleration attracts global suppliers; aluminium supply takes centre stage
As ongoing geopolitical tensions of the Middle East conflict and the resulting inflation and shifting market dynamics bring Europe and the United States to experience a fading demand in the automotive industry, including Ford Motor Company, Stellantis, General Motors, and Volkswagen Group, auto component manufacturers eye the automotive market of India, which has been displaying robust growth. Since the 1991 de-licensing, the sector has been backed by the ‘Make in India’ initiative. The post-pandemic boom cemented India’s position as the fourth-largest player in automobile production on the global platform. Explore- Most accurate data to drive business decisions with Global ALuminium Industry Outlook 2026 across the value chain Although India does not remain untouched by the impacts of...

US' declining bauxite imports in 2025: A critical overview
The United States has long been a net importer of bauxite, owing to the small domestic reserves located in Arkansas, Alabama, and Georgia. This trend has not changed much except the numbers going up or down in 2025. Jamaica and Turkey, the only two primary exporters of bauxite to the US, have remained firm, albeit the amount dropped year-on-year, leading to the decline in the United States’ total bauxite imports. Factors driving the decline in the US bauxite imports The erosion of alumina refining capacity in the domestic market from 5 million tonnes in 2000 to nearly 600,000 tonnes today has practically reduced the demand for bauxite in the United States. At present, only one refinery - Atlantic Alumina’s Gramercy plant in Louisiana is running but at its one-third capacity, producing...

Here’s why we deduce red mud to be aluminium industry’s next resource frontier
For decades, the aluminium industry has lived with a structural contradiction: for every tonne of alumina produced, it generated up to 1.5 tonnes of highly alkaline waste. That equation has now reached a breaking point. With global alumina output crossing 141 million tonnes in 2023 and 154 million tonnes in 2025, annual bauxite residue generation has already exceeded 175 million tonnes. The cumulative stockpile stands at an estimated 4 billion tonnes, making it one of the largest untapped secondary mineral reserves on the planet. In 2026, that legacy is no longer being managed. It is being mined. Not sustainability alone, but a convergence of economics, regulation, and geopolitics Red mud, long treated as a disposal liability due to its pH of 10-13 and contamination risks, is now being...

36Mt of global alumina capacity remains unutilised, with China and Asian region showing the widest gap
Global metallurgical alumina production has been expanding in a measured and consistent manner. Output rose from 130.4 million tonnes in 2021 to 133.1 million tonnes in 2022, followed by gradual increases to 134.8 million tonnes in 2023 and 137.8 million tonnes in 2024. The trajectory strengthened in 2025, with production reaching 144.9 million tonnes, reflecting a sharper 5.2 per cent rise. However, the underlying dynamics point to a market that is not constrained by supply capacity. With global installed refining capacity at around 181 million tonnes in 2025 and utilisation levels between 85 per cent and 87 per cent, nearly 36 million tonnes of capacity remains unutilised. This indicates that output is being actively managed rather than maximised, with producers responding to demand...

Solar subsidies, aluminium shocks, and the 2026 market redone by geopolitical distress
The global energy transition has reached a point where renewable policy and industrial metals are structurally interlocked. With one month into Q2 2026, solar installation subsidies and aluminium supply chains have formed a feedback loop that is actively redoing both markets. Aluminium, long described as ‘congealed electricity,’ sits at the centre of this convergence, with the solar PV sector accounting for around 87 per cent of incremental aluminium demand within renewables. What distinguishes the 2025-2026 phase is not growth, but correction. China’s solar PV subsidy withdrawal, the European Union’s conditional incentives, the US’ tightening domestic rules, and a sudden geopolitical-induced trade disruption in the Middle East have collectively dismantled the assumptions of the previous...

India’s anti-subsidy probe on Malaysia’s aluminium wire rod imports for domestic boost
The Government of India, through its Directorate General of Trade Remedies (DGTR) under the Ministry of Commerce, has launched an anti-subsidy investigation on aluminium wire products from Malaysia. The concern for a probe was raised by the leading Indian aluminium manufacturers, such as Vedanta Limited, Hindalco Industries Limited, and Bharat Aluminium Company Limited, urging for a review to finalise an extension to the duties for trade protections. On Monday, the government announced that the probe has been made in light of the existing countervailing duties (CVDs) on Malaysia’s exports of “Aluminium Wire/Wire Rods above 7 mm diameter” (HSN code: 760511) that are scheduled to lapse in September. Under World Trade Organisation rules, countries can levy such duties to protect domestic...

India: Imported aluminium scrap prices show mixed trends despite LME strength, supply tightness
India's imported aluminium scrap prices exhibited mixed movements w-o-w as of 28 April 2026, despite an uptrend on the London Metal Exchange (LME), ongoing geopolitical tensions, and constrained global supply. According to BigMint's latest assessment for CFR Nhava Sheva deliveries, UK-origin zorba 95-5 scrap eased by USD 45 per tonne W-o-W to around USD 2,875 per tonne, reflecting a correction after the recent rally. In contrast, US-origin tense 6-7 per cent scrap gained USD 10 per tonne W-o-W to USD 2,740 per tonne. LME aluminium strengthens w-o-w Three-month aluminium prices on the London Metal Exchange (LME) increased by USD 35.5 per tonne to USD 3,588 per tonne on 27 April 2026 from USD 3,552.5 per tonne on 20 April 2026, indicating continued strength in market sentiment. Meanwhile,...
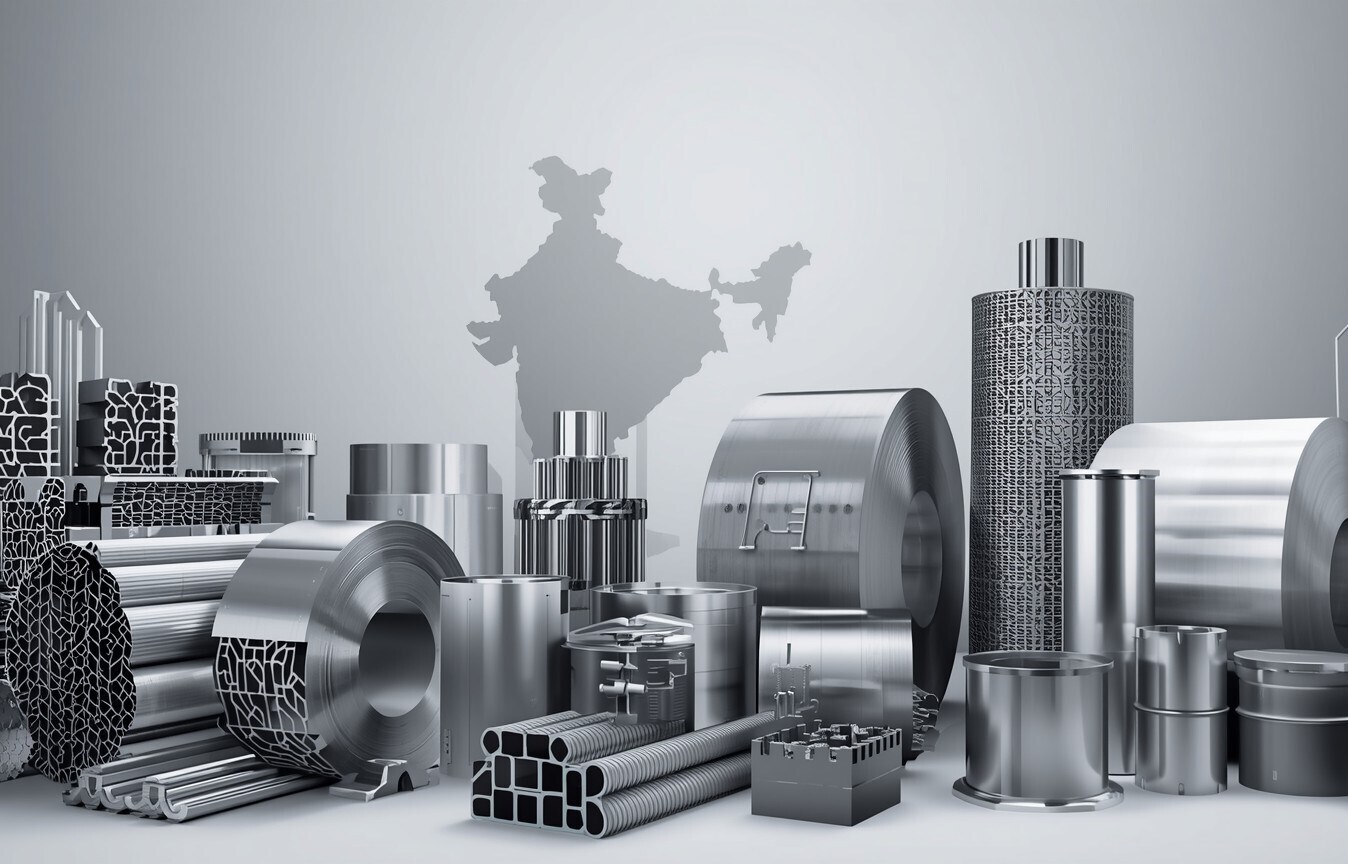
Can India sustain 8.25% aluminium duties when 55% of demand is imported?
India’s aluminium tariff regime, especially now in 2026, has become a regulatory fault line between upstream smelters chasing security, downstream processors absorbing cost pressure, recyclers fighting for cheaper feedstock and the country is trying to balance it all to keep a lid on inflation while building a strategic industrial base. A tariff to protect, but not to simplify At the centre of the debate is India’s differentiated duty structure. Primary aluminium under HS 7601 is charged at 8.25 per cent, scrap under HS 7602 at 2.5 per cent, bars, rods, profiles, plates, sheets and strips at 7.5 per cent, foil at 7.5 per cent-10 per cent, and finished structures and articles at 10 per cent. That means that the duty structure has created a constant friction point, because preferential...

