US bauxite imports decline 14.5% in H1 2026 while volumes climb 6.9%

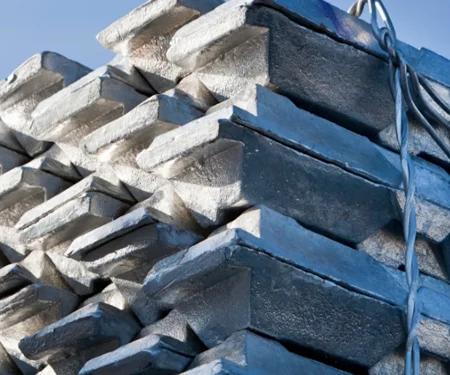
The image used in this article is generated with an AI tool and does not depict any real-time moment.
US imports of bauxite and other aluminum ores and concentrates fell 14.5% year-on-year to $68.46 million in the first half (H1) of 2026, according to Trade Map data. In terms of volumes, however, imports rose 6.9% year-on-year to 1.27 million metric tons, from 1.19 million metric tons in H1 2025. The decline in value followed a 5.7% increase during H1 2025.
The H1 2026 import value was also 9.7% below the $75.77 million recorded in H1 2024, while volume was 8.3% lower than the 1.39 million metric tons recorded that year.
US bauxite imports weaken in both quarters of H1 2026
Q2 2026 import volume increased 7.8% year-on-year to 643,950 metric tons from 597,195 metric tons. In contrast, import value reached $30.61 million in Q2 2026, down 10.7% from $34.28 million in Q2 2025 and 6.2% from $32.63 million in Q2 2024.
Q1 2026 import volume rose 6% to 630,499 metric tons from 594,906 metric tons in Q1 2025.
The corresponding value was $37.85 million, down 17.4% from $45.8 million in Q1 2025 and 12.3% from $43.14 million in Q1 2024.
Overall, H1 2026 imports stood at 1.27 million metric tons, valued at $68.46 million, compared with 1.19 million metric tons, valued at $80.078 million in H1 2025 and 1.39 million metric tons, valued at $75.768 million in H1 2024.
Explore the production, demand and consumption forecasts of bauxite and alumina in our report: "Global Bauxite & Alumina Market Forecast to 2036: Supply–Demand, Trade Flows & Price Outlook"
Top bauxite suppliers to the US
Jamaica was the leading supplier by volume, shipping 948,333 metric tons in H1 2026, equivalent to 74.4% of total US imports.
Guyana ranked second at 167,078 metric tons, or 13.1%, followed by Türkiye at 77,605 metric tons, Australia at 49,500 metric tons, and China at 5,920 metric tons.
By value, Guyana led with $33.29 million, or 48.6% of the H1 total, up 7.3% from $31.02 million in H1 2025 and 77.1% from $18.79 million in H1 2024.
Jamaica ranked second by value at $23.71 million, accounting for 34.6% of H1 2026 imports. Its shipments increased 5.9% from $22.39 million in H1 2025 but remained 15.4% below the $28.03 million recorded in H1 2024.
Türkiye supplied $3.96 million, representing 5.8% of the total, down 38.5% from $6.44 million in H1 2025. Australia followed with $3.35 million, or 4.9%, down 60.9% from $8.56 million. China accounted for $2.244 million, or 3.3%, a 72.5% decline from $8.17 million in H1 2025.
Together, the five leading suppliers accounted for 97.2% of US bauxite imports by value and 98.1% by volume in H1 2026.
US bauxite import pattern shifts in 2026
The H1 data shows a divergence between import value and physical volume. While the value of US bauxite imports declined in both Q1 and Q2 2026, the corresponding physical volumes increased.
At the supplier level, Jamaica dominated by volume, while Guyana led by value. Together, the five leading suppliers accounted for nearly the entire US import volume in H1 2026, highlighting the concentration of the country's bauxite supply base.
Looking for alumina refinery raw materials? Compare grades, explore sourcing options, and connect with global suppliers on AL Biz.
Note: This is exclusive coverage by AL Circle and may not be reproduced, republished or shared without prior permission.
Canyon Resources’ Minim Martap bauxite project faces fresh uncertainty over funding and first shipment
Next articleHydro appoints Hanne Simensen as new EVP for Bauxite & Alumina
Grow with
AL Circle