Renewable energy is moving from supportive to strategic role as it is set to account for 45 per cent of the global electricity generation. This marks a structural shift in how industries will be powered. China, Europe, the United States, and India are at the centre of this transformation, driven by rapid additions in solar, wind, and hydropower capacity. While these regions lead the clean energy buildout, they also represent some of the world’s most significant aluminium production hubs, where electricity remains the single most critical input cost. So, this calls for an evaluation that how far the clean power surge in these regions is translating into lower-carbon aluminium production across these major regions.
Before that assessment, the scale of the renewable buildout itself deserves attention. According to the International Energy Agency, global renewable power capacity is expected to reach 4,600 GW between 2025 and 2030, nearly double the growth recorded in the previous five-year period. Solar power will remain the dominant growth engine, accounting for 80 per cent of new renewable electricity capacity, while onshore wind, offshore wind, and hydropower will continue to provide balance and system support.
Solar energy is winning the race
At the end of 2025, cumulative global solar PV capacity was close to 2,900 GW after an addition of 647 GW of solar capacity. Together solar and wind capacity, new installation reached 814 GW, bringing global installed capacity to 4,174 GW. Individually, new installation of solar capacity grew 11 per cent Y-o-Y, while wind deployment jumped 47 per cent annually, rising from 113 GW to 167 GW. By the end of 2025, global installed wind capacity reached around 1,300 GW.
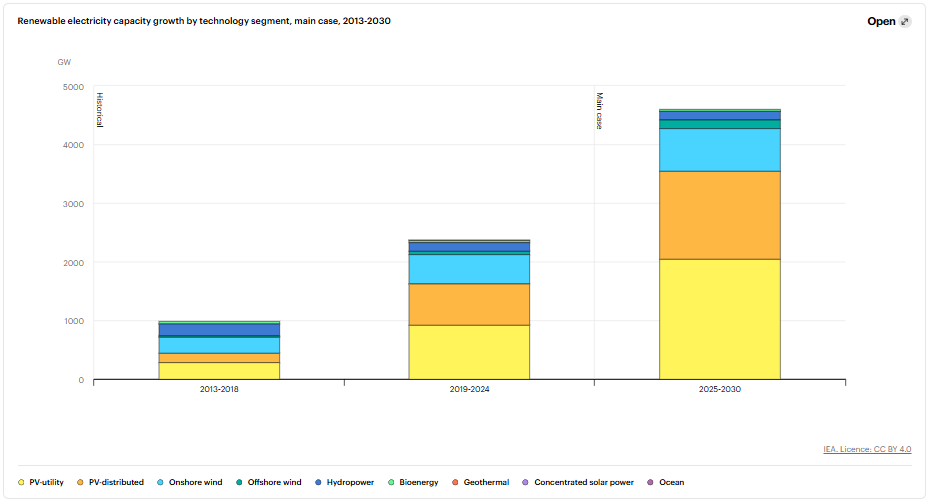
Source: International Energy Agency
Comparing the range of five years since 2013, solar PV-utility and PV-distributed capacity soared by 270 per cent from 438 GW (during 2013-18) to 1,621 GW (2019-24) and is expected to further leap to 3,545 GW, representing a surge of 118 per cent from the previous five-year period. During 2013-18, onshore and offshore wind capacity was at 297 GW, which grew over the next five years by 90 per cent, amounting to 565 GW. IEA projects the cumulative wind capacity to reach 872 GW by 2030, recording an increase of 54 per cent from 2019-2024.
For the global aluminium value-chain 2026 outlook, book our exclusive report “Global ALuminium Industry Outlook 2026"
Country-wise solar installations
Among all the countries leading the way in solar PV installation, China is the first in the world. The country installed 315 GW of new panels in 2025, bringing the total capacity to nearly 1,300 GW. Data from Taipei-based LowCarbonPower shows 11 per cent of China’s electricity comes from solar energy. The European Union ranks the second with 406 GW of new solar capacity and covering 13 per cent of the bloc’s electricity demand. While in China, the share of coal power has dropped from 70 per cent to 56 per cent, in EU, coal only meets 9 per cent of the energy demand.
In Europe, the highest solar power generators are Greece, Cyprus, Spain, and Hungary as each of them generates more than 20 per cent of their electricity through solar.
The United States holds the third position even though the country’s solar installation decreased 14 per cent Y-o-Y. The new installation was 43.2 GW, bringing the total capacity to 267 GW. Solar capacity in the US currently supplies 8 per cent of the energy demand, while coal power has dropped from 34 per cent in 2015 to 17 per cent in 2025.
If you are looking for tense scrap, visit our B2B platform
China leads wind capacity, followed by the US and India
Of the 165 GW of wind capacity installed in 2025, onshore wind accounted for 155.3 GW, representing Y-o-Y increase of 42 per cent and crossing the 150 GW thresholds for the first time in a single year. The remaining 9.3 GW capacity was contributed by offshore wind, up 16 per cent Y-o-Y. In this category as well, China leads with 120 new GW of wind capacity installed in 2025. Additionally, the country has received 124.4 GW of future capacity approval under China’s new market oriented pricing mechanism introduced in February 2025. This mechanism mirrors elements of contracts for difference (CfDs) used in the UK and Germany, designed in a way that if market prices fall below on agreed level, generators are reimbursed. On the other hand, they will pay back the difference if prices exceed the threshold. This system ensures revenue stability for renewable energy generators.
After China, the United States and India are the two leading countries in wind energy capacity with new installations of 7 GW and 6.34 GW of onshore capacity in 2025. While in the US, new wind capacity installation grew 71 per cent Y-o-Y, in India, it increased by 85 per cent, placing the country in the third position globally for new annual installations. In India, solar installed capacity touched 132.85 GW and wind reached 54 GW towards the end of 2025. In Germany and Brazil, new wind capacity installations were 5.2 GW and 2.3 GW, respectively, in 2025.
With the increase in solar and wind power capacity across the world, renewable energy accounted for 33.8 per cent of total global electricity generation, according to the data revealed by the Ember analysis centre. Interestingly, the share of renewable energy in the global power mix exceeds that of coal-based energy share at 33 per cent. Record shows solar, wind, hydro power, and other renewable sources together accounted for more than one-third of global electricity generation for the first time in history in 2025.
To learn the aluminium industry leaders' perspectives about the current market, read "ALuminium LeaderSpeak 2026"
How much of this renewable energy is used in these countries’ aluminium sector?
What we derive from the above is that China is the leading country in solar and wind capacity installation. In total, the country has the highest renewable energy capacity in the world with over 2.34 TW installed by the end of 2025. This represents 60 per cent of China’s total installed power capacity, with 35 to 42 per cent contribution to electricity generation. So, the remaining 55 to 58 per cent of China’s electricity is still supplied by coal.
Now, the aluminium industry in China, which consumes around 750-800+ billion kilowatt-hours (kWh) of electricity for producing 44-45 million tonnes of the metal, has transitioned 25 per cent of its power sourcing from coal to renewable. So, going by the calculation, 187.5 to 200 billion kWh of electricity used in China’s aluminium production comes from renewable energy sources, which is approximately 8.02 to 8.51 per cent of renewable capacity.
The European Union, where solar energy capacity ranks second in the world, sources 78 per cent of electricity from renewable energies for aluminium production, according to data revealed by the European Aluminium in 2023. Hence, its carbon emissions are 60 per cent lower than the global average. Roughly 15 MWh of electricity per tonne of aluminium is used for aluminium production in the EU, of which 78 per cent is from renewable sources; hence 11.7 MWh of renewable is used for producing per tonne of aluminium in the region.
In 2025, 47.3 per cent of the electricity generated in the European Union was from renewable energy sources, up from 47.2 per cent share in 2024. Wind was the primary source, accounting for 37.5 per cent of the total electricity, solar came in second contributing 27.5 per cent, followed by hydro with 25.9 per cent.
In the United States, wind and solar energy generated a record 17 per cent of electricity in 2025, which amounted to 760,000 gigawatthours of electricity, showed the data from the US Energy Information Administration. Individually, wind power generated 464,000 GWh of electricity and solar produced 296,000 GWh. However, despite the robust sources of renewable energy in the United States, it is unknown that how much goes into aluminium production. Only, as per the Aluminum Association’s website, it is only known that a single aluminium smelter uses approximately 11 TWh of electricity.
In India, where 44.5 GW of renewable energy capacity is installed in 2025 and 3.3 per cent fossil power generation has reduced, aluminium industry is moving fast towards the adoption of non-fossil fuel energy. Since the country’s aluminium industry still relies on 85 per cent coal-based power, it is taking phase-wise approach to increase the share of renewable energy in the mix. Recently, Vedanta Limited, India’s leading metals, oil & gas, critical minerals, power, and technology conglomerate, announced that it increased its renewable energy usage by 50 per cent to 3.97 billion units (BU) in FY26, avoiding 3 million tonnes of carbon dioxide emissions during the year. As of FY2025, Vedanta Aluminium reported the consumption of 1.57 billion units of green energy. By 2030, India’s aluminium sector plans to add 20 GW of renewable energy capacity by investing INR 42,500 crore (USD 4.51 billion).
The numbers above make it clear that renewable energy expansion does not automatically translate into low-carbon aluminium. Capacity additions in solar, wind, and hydro are important, but the decisive factor is whether clean electricity is reaching energy-intensive industries at scale, consistency, and competitive cost. At this moment, Europe is the most advanced in linking renewable electricity with aluminium production, while China, despite being the global leader in renewable installations, still faces the contradiction of a coal-heavy grid even as its aluminium sector gradually raises renewable sourcing.
Even the United States, in spite of having strong renewable momentum, lacks transparent visibility on how much of that power is flowing into aluminium smelting. India, comparatively, is at a strategically important stage, where ambitious renewable investments could reshape the long-term competitiveness of its aluminium industry.