US Alumina imports reach 712kt in H1 2026, up 2.7% despite Q2 decline
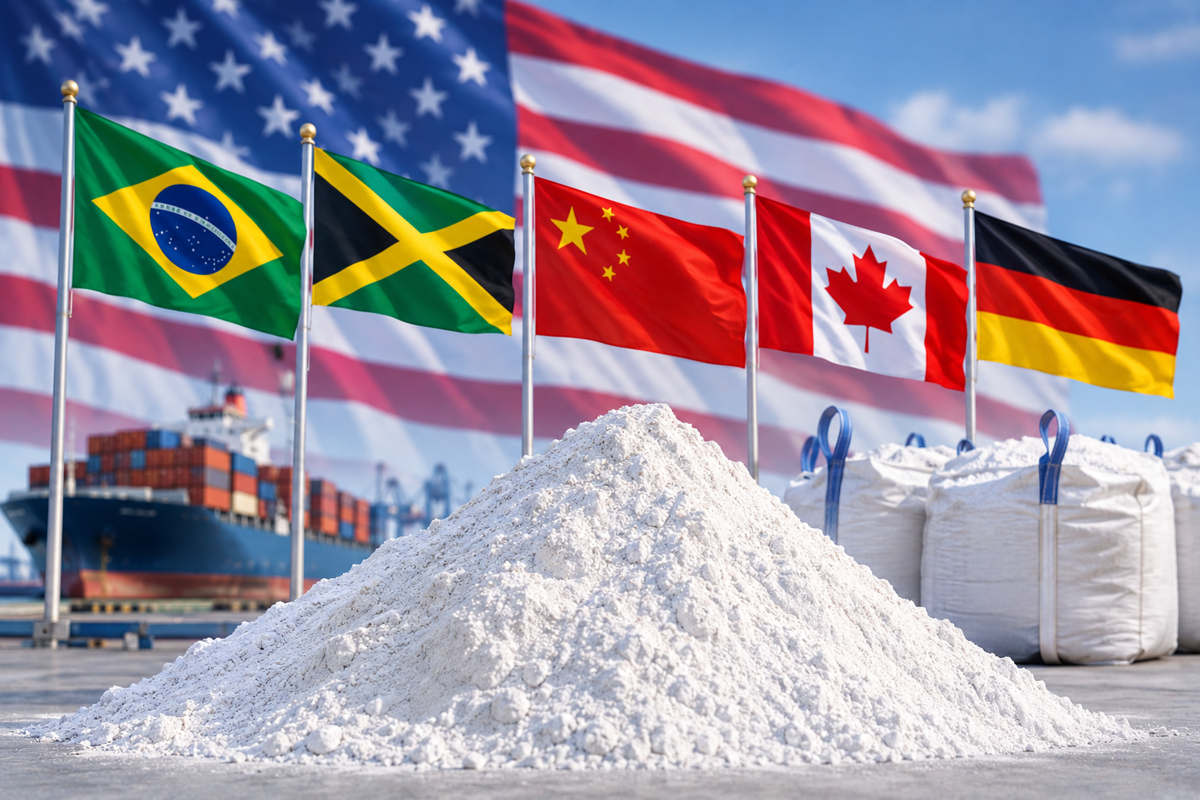
The image used in this article is generated with an AI tool and does not depict any real-time moment
Alumina imports in the United States increased in the first half of 2026 compared with the same period in 2025, although imports fell sharply in the second quarter. Total imports reached 712,000 tonnes in H1 2026, up 2.7 per cent from 693,000 tonnes in H1 2025. The H1 2024 total was 495,000 tonnes.
Imports in Q1 2026 reached 446,000 tonnes, up 32 per cent from 337,000 tonnes in Q1 2025. However, imports dropped to 266,000 tonnes in Q2 (a 25 per cent decline) from 356,000 tonnes in the same quarter a year earlier.
Brazil remains the largest supplier
Brazil remained the largest exporter of alumina to the US during the period covered by the data. Its shipments reached 568,000 tonnes in H1 2026, around 5 per cent increase from 542,000 tonnes in H1 2025. In H1 2024, Brazil supplied 430,000 tonnes.
To know the futuristic market and value proposition of red mud, explore the report "A Comprehensive Analysis of Bauxite Residue (Red Mud): Sustainability, Resource Recovery and Strategic Recommendations"
Alumina shipments were 342,000 tonnes in Q1 2026, up from 270,000 tonnes in Q1 2025 (up 27 per cent). The volume was also 141,000 tonnes higher than the 201,000 tonnes recorded in Q1 2024.
However, Brazilian shipments fell in Q2 2026. Exports dropped to 226,000 tonnes from 272,000 tonnes in Q2 2025 (17 per cent decline). The Q2 2026 volume was slightly below the 229,000 tonnes recorded in Q2 2024.
China records higher H1 shipments
China was the second-largest exporter among the countries listed in H1 2026. Its shipments reached 26,700 tonnes, up 12 per cent from 23,800 tonnes in H1 2025. The H1 2024 volume was 20,400 tonnes.
China's exports rose in Q1 2026 to 19,000 tonnes from 16,000 tonnes in Q1 2025, an increase of 19 per cent. Q2 shipments were almost unchanged at 7,700 tonnes in 2026, compared with 7,800 tonnes in 2025.
Explore alumina and other essential inputs in the right grades from global suppliers on AL Biz
Canada also recorded a small increase in H1 shipments. Its exports reached 14,400 tonnes in H1 2026 from 14,200 tonnes in H1 2025. The H1 2024 figure was 12,200 tonnes.
Canada's Q1 shipments fell to 7,400 tonnes in 2026 from 7,900 tonnes in 2025. In Q2, however, exports rose to 7,000 tonnes from 6,300 tonnes year on year.
Jamaica sees sharpest fall
Jamaica recorded the largest decline among the listed exporters. Its H1 shipments fell to 14,000 tonnes in 2026 from 58,000 tonnes in 2025, a drop of 76 per cent. In H1 2024, Jamaica supplied 11,000 tonnes.
The country shipped 32,000 tonnes in Q1 2025 and 26,000 tonnes in Q2 2025. In 2026, it recorded no shipments in Q1 before exporting 14,000 tonnes in Q2.
Germany's shipments remained relatively stable. It supplied 6,200 tonnes in H1 2026, up 11 per cent from 5,600 tonnes in H1 2025. The H1 2024 volume was 6,300 tonnes.
Unlock key insights from leading companies and experts across the aluminium ecosystem with our e-Magazine - Mine to Market: Aluminium Producers & Manufacturers 2026
The exports were 3,200 tonnes in Q1 2026 and 3,000 tonnes in Q2 from Germany. The corresponding figures in 2025 were 2,300 tonnes and 3,300 tonnes.
Brazil remained far ahead of the other listed exporters in US alumina shipments. China recorded the strongest H1 growth among the listed suppliers at 12 per cent, while Jamaica saw the sharpest decline. Total US alumina imports increased in H1 2026, although the second-quarter figure was lower than a year earlier.
Grow with
AL Circle