Global alumina production remains below 2025 levels despite a Q3 rebound, reaching 114 million tonnes in 9M2026

The third quarter brought a clear improvement in global alumina production. It did not, however, bring production back to the level recorded a year earlier.
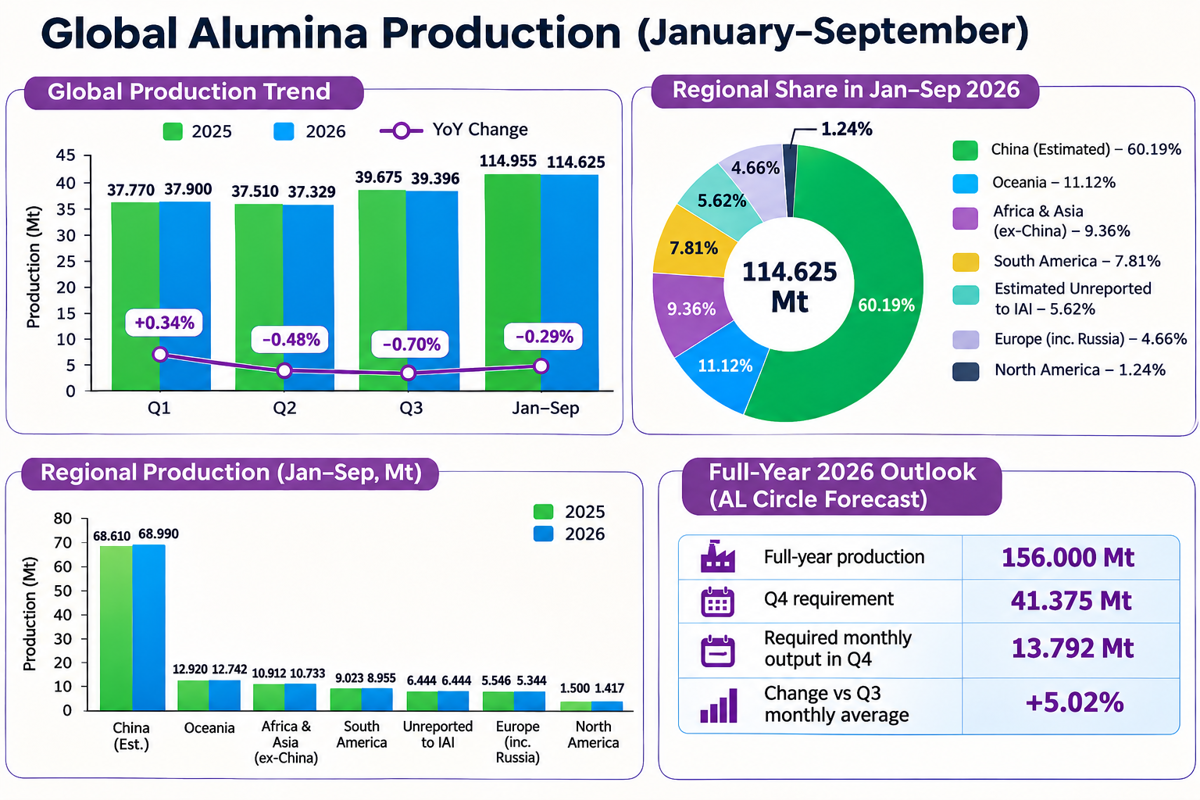
Global alumina output has reached 114.625 million tonnes in the first nine months of 2026, down 330,000 tonnes or 0.29% (114.955 million tonnes in 2025) year-on-year. China's estimated production increased, but declines across most other reporting regions erased that gain.
The quarterly sequence reveals how the production gap has developed.
In the July to September 2026 quarter, alumina output reached 39.396 million tonnes, an increase of 5.54% over the preceding quarter. Yet the same quarter in 2025 had delivered 39.675 million tonnes. The latest production total was therefore 279,000 tonnes lower Y-o-Y.
The first quarter of 2026 began slightly ahead of the previous year. That advantage disappeared in Q2, and the gap widened further during Q3. What initially looked like a relatively stable production year has consequently turned into one in which the latest quarterly improvement has yet to translate into year-on-year growth.
The nine-month deficit developed progressively:
| Period | 2025 production (Mt) | 2026 production (Mt) | Change (kt) | YoY movement |
|---|---|---|---|---|
| Q1 | 37.770 | 37.900 | +130 | +0.34% |
| Q2 | 37.510 | 37.329 | -181 | -0.48% |
| Q3 | 39.675 | 39.396 | -279 | -0.70% |
| Q1–Q3 | 114.955 | 114.625 | -330 | -0.29% |
There is a striking similarity between the quarterly patterns of the two years. In 2025, production declined by 260,000 tonnes from Q1 to Q2 before increasing by 2.165 million tonnes in Q3. In 2026, the corresponding movements were a 571,000-tonne decline followed by a 2.067-million-tonne increase.
The third-quarter recovery was therefore not unique to 2026. Both years recorded a considerable increase over Q2, although the latest recovery was smaller in absolute terms.
The more revealing difference lies in the Y-o-Y comparison. Q1 2026 delivered 130,000 tonnes more than Q1 2025, but Q2 fell 181,000 tonnes short of its year-earlier level. The third quarter added another 279,000-tonne shortfall.
By September, the initial surplus had been replaced by a cumulative deficit. The resulting contraction is small relative to global output, but it establishes a different picture from one based exclusively on the sequential Q3 increase.
Explore alumina and other essential inputs in the right grades from global suppliers on AL Biz
China's expanding share contrasts with weaker production elsewhere
The geographical distribution makes the nine-month comparison more interesting. China was the only geographical reporting category to record a cumulative increase. Every other regional category reported lower production, while estimated unreported output remained unchanged.
China's estimated production increased from 68.610 million tonnes in January–September 2025 to 68.990 million tonnes in the same period of 2026. The additional 380,000 tonnes represented growth of 0.55%.
That increase was not sufficient to offset the combined 710,000-tonne reduction across Oceania, Africa & Asia (excluding China), South America, Europe and North America. The net global decline consequently amounted to 330,000 tonnes.
| Region | Jan-Sep 2025 (kt) | Jan-Sep 2026 (kt) | Change (kt) | Y-o-Y change |
|---|---|---|---|---|
| China (Estimated) | 68,610 | 68,990 | +380 | +0.55% |
| Oceania | 12,920 | 12,742 | -178 | -1.38% |
| Africa & Asia (ex-China) | 10,912 | 10,733 | -179 | -1.64% |
| South America | 9,023 | 8,955 | -68 | -0.75% |
| Estimated Unreported to IAI | 6,444 | 6,444 | 0 | 0.00% |
| Europe (including Russia) | 5,546 | 5,344 | -202 | -3.64% |
| North America | 1,500 | 1,417 | -83 | -5.53% |
China's share of global production consequently rose from 59.68% to 60.19%. Its contribution is now slightly more concentrated than it was during the corresponding nine-month period last year.
The distinction between absolute and percentage movements is also important. Europe recorded the largest absolute regional reduction, at 202,000 tonnes, while North America experienced the steepest percentage decline, at 5.53%. The latter figure needs to be viewed against North America's much smaller production base.
This geographical divergence is more consequential than the modest movement in the global total might initially suggest. The aggregate has remained relatively stable, but the distribution of production has shifted further towards China.
China's contribution changed through the year
China's quarterly performance was not uniformly strong throughout 2026. Production stood at 22.5 million tonnes in Q1, exactly matching the corresponding 2025 figure. It subsequently increased to 22.58 million tonnes in Q2, compared with 22.15 million tonnes a year earlier.
The third quarter was less favourable on a Y-o-year basis. Estimated Chinese output reached 23.91 million tonnes, slightly below the 23.96 million tonnes reported for Q3 2025.
The cumulative increase therefore came principally from the second-quarter improvement rather than an uninterrupted rise against the previous year. Even so, China's estimated contribution was sufficient to offset more than half of the combined declines across the other geographical reporting regions.
AL Circle's April 2026 Global Bauxite & Alumina Market Forecast to 2036 identifies China as the largest centre of alumina refining, with extensive domestic capacity and production concentrated in provinces including Shandong, Shanxi and Guangxi. The report also discusses additional Chinese refinery projects expected to expand capacity during 2026.
The distinction between installed capacity and operating production remains essential here. Capacity additions indicate the potential to produce more alumina; they do not establish how much additional material actually entered the market during a particular quarter.
There is also a statistical qualification. The supplied series explicitly labels China's contribution as estimated. The IAI confirms that China's production estimates are derived using information outside its standard voluntary company reporting system. Its total alumina statistics combine metallurgical-grade and chemical-grade production, expressed as nominal Al₂O₃ equivalent.
Oceania and South America reveal different operating pressures
Oceania's nine-month output declined by 178,000 tonnes Y-o-Y, despite a stronger third-quarter result. The region's Q3 production reached 4.454 million tonnes, compared with 4.373 million tonnes in Q3 2025. The 81,000-tonne improvement followed a 107,000-tonne year-on-year reduction in Q2.
Alcoa's October 2026 quarterly disclosure provides one example of the operating improvement taking place within the region. Its alumina production increased 11% sequentially to approximately 2.5 million metric tonnes in Q3, with the company attributing the improvement primarily to greater operational stability at its Pinjarra refinery in Western Australia.
The company's performance is a useful operational example, although it should not be mistaken for the entire Oceania production trend. The regional series still recorded lower cumulative output than in 2025.
The outlook for the region's final quarter also faces a known production constraint. Rio Tinto had announced that it would reduce production at its Yarwun refinery by 40% from October 2026, citing tailings storage limitations and the need to extend the operating life of the facility. The company estimated that the decision would reduce annual production by around 1.2 million tonnes. This is an annualised production impact and should not be interpreted as a 1.2-million-tonne loss occurring entirely during Q4.
South America presents a different operating picture. Production fell in each successive quarter, from 3.038 million tonnes in Q1 to 2.928 million tonnes in Q3. Its nine-month total was 68,000 tonnes below the 2025 level.
Brazil's Hydro Alunorte refinery encountered a documented operational interruption when its natural gas supplier notified the facility of supply disruptions. Hydro temporarily reduced alumina production to 50% as a contingency measure. Following an agreement concerning terminal access and regulatory approval for direct gas imports, the refinery began ramping output towards full capacity.
Hydro estimated that the disruption resulted in lost production of 100,000-120,000 tonnes. The company identified this as a potential Q3 financial impact alongside the higher cost of replacement gas.
Explore the production, demand and consumption forecasts of bauxite and alumina in our 2026 updated report "Global Bauxite & Alumina Market Forecast to 2036: Supply–Demand, Trade Flows & Price Outlook"
Africa & Asia outside China lost ground after a stronger Q1
The combined Africa & Asia (excluding China) category registered one of the more pronounced changes during the year.
Its output of 3.845 million tonnes in Q1 2026 was 356,000 tonnes higher than the corresponding 2025 quarter. The improvement did not persist. Q2 production dropped to 3.239 million tonnes, 419,000 tonnes below Q2 2025, before recovering to 3.649 million tonnes in Q3.
The region's nine-month total reached 10.733 million tonnes, down 179,000 tonnes from 2025.
This category includes a diverse group of producing countries, among them India, Guinea, Indonesia, Vietnam, Turkey and Saudi Arabia. The IAI's reporting framework aggregates their production rather than providing a complete country-by-country breakdown.
Europe's decline was greater in absolute terms than North America's
Europe, including Russia, recorded 5.344 million tonnes of alumina production during the first nine months, down 202,000 tonnes from 2025. Production increased from Q1 to Q2 but then remained almost unchanged in Q3, at 1.813 million tonnes.
The region's established operating constraints provide some context. AL Circle's report identifies elevated energy costs and reduced refinery operating rates as factors affecting European alumina production. It specifically discusses the prolonged reduced-rate operations at Alcoa's San Ciprián refinery in Spain.
North America experienced a more pronounced percentage reduction, although its smaller production base meant that the absolute decline was limited to 83,000 tonnes. Output moved from 533,000 tonnes in Q1 2025 to 492,000 tonnes in Q1 2026, with the subsequent quarters remaining below their respective 2025 levels.
The two regions therefore contributed to the global contraction in different ways. Europe's reduction was more material in terms of lost tonnage, while North America's decline was more pronounced relative to its existing output.
The 2026 production forecast
The nine-month comparison now provides an important starting point for examining the full-year outlook.
AL Circle's 2026 market forecast report projects annual production of 156 million tonnes, compared with its reported 2025 production of 154.103 million tonnes. This represents an implied increase of approximately 1.23%.
The three quarters’ productions’ resulting concentration means that the global production total is becoming increasingly dependent on the performance of China's refining sector.
The remaining question is whether Q4 can deliver the volume required by the higher annual estimate. The lower forecast calls for a continuation of the recent operating pace. Au contraire, the higher one requires a further step-up at a time when individual refineries are facing both recovery opportunities and operating constraints.
Unlock full access – sign up for FREE.
Key benefits
From losses to profits: VALCO sets sights on 1.5 million tonnes of alumina
Next articleAtlas Metals terminates UPSA acquisition as lithium and graphite deals take priority
Grow with
AL Circle