China’s H1’26 alumina market’s new trade equation: 749% import surge meets 118.92MTPA capacity
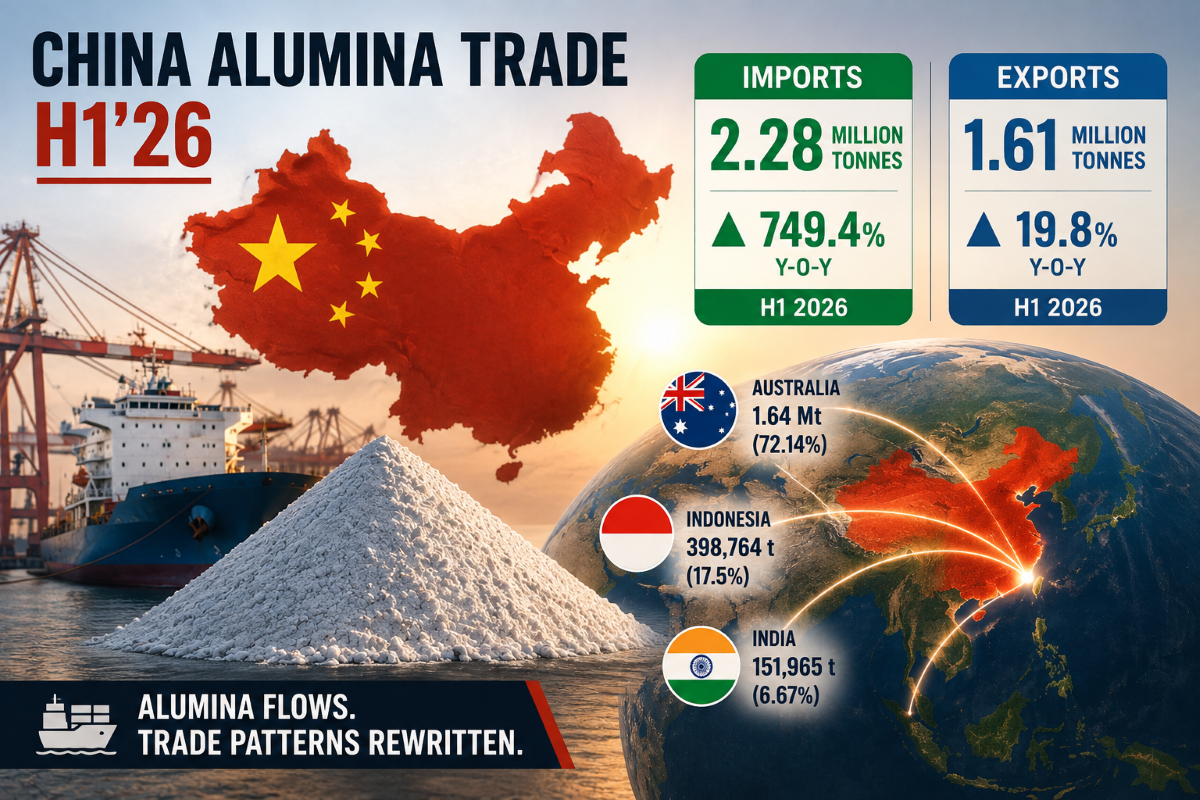
The image used in this article is generated with an AI tool and does not depict any real-time moment
China’s aluminium export surge in the first half (H1) of 2026, crossing 250,000 tonnes, has come with a surge in its alumina imports as well, feeding the smelting and primary aluminium production. China’s January-June alumina imports marked a drastic year-on-year surge of about 749.4 per cent, indicating a massive boom in demand.
Y-o-Y H1 import snapshot: 2026 vs 2025 vs 2024
Comparing China’s January-to-June alumina import figures, a significant development can be noted in the H1 2026 chart.
2026 – 2.28 million tonnes, up 749.4 per cent Y-o-Y from 268,211 tonnes in H1 2025
2025 – 268,211 tonnes, down 77.37 per cent Y-o-Y from 1.19 million tonnes in H1 2024
The figures offset the H1 2025 import decline, partially driven by the steep alumina prices around late 2024 exceeding USD 800 per tonne, coupled with production surplus in 2025, relative to its capped smelting growth.

To know the futuristic market and value proposition of red mud, explore the report “A Comprehensive Analysis of Bauxite Residue (Red Mud): Sustainability, Resource Recovery and Strategic Recommendations”
Why the massive import surge?
The import figures indicate that the softening of alumina price margins, hovering around USD 330 per tonne by mid-2026, helped surpass the H1 2024 import levels.
A similar sharp surge in the quarter-on-quarter import trend can be noted as well. In Q2, China imported 1.5 million tonnes of alumina, surging Q-o-Q by 92.18 per cent from the Q1 import volume of 779,733 tonnes.
Looking closely, the rise in imports has come hand-in-hand with a similar spike in exports. Considering the quarterly figures, Q2 reported exports of 1.07 million tonnes, up 95.87 per cent Q-o-Q from the 543,913 tonnes reported in Q1. The H1 cumulative of 1.61 million tonnes also reflects a Y-o-Y surge over the H1 2025 export cumulative of 1.34 million tonnes by 19.8 per cent.
Hence, China was not simply importing alumina because domestic supply was insufficient.
The sharp rise in imports as well as exports was largely driven by the Middle East conflict, which disrupted established alumina trade routes and diverted cargoes originally bound for the region to China. Owing to disrupted logistics, some of these shipments were subsequently re-exported from China to Middle Eastern markets, resulting in a notable increase in both Chinese alumina imports and exports.
Domestic production adds another layer
China remained the world’s largest alumina producer, with estimated output rising by 1 per cent Y-o-Y to 42.82 million tonnes in H1 2026 from 42.42 million tonnes in H1 2025.
Rather than tightening the domestic market, the sharp rise in imports added to an already well-supplied environment. Refinery operating rates remained high as new production capacity, particularly in Guangxi, continued to ramp up.
At the same time, increased arrivals of competitively priced seaborne alumina, led by Australia, have added to inventories at Chinese ports. The resulting inventory overhang kept domestic spot alumina prices largely capped at around RMB 2,700 (USD 400.4) per tonne.
However, strong domestic production combined with higher imports has increased port inventories, keeping China’s alumina market under pressure. Meanwhile, China maintained steady alumina output through new capacity additions despite weaker refinery margins.
Therefore, the inference drawn from this aspect is that higher domestic output, coupled with massive imports and higher exports, generates a complicated trade-flow story rather than a straightforward supply deficit.
Explore buying & selling leads of alumina and trade opportunities on AL Biz platform.
Top sources of China’s alumina imports in H1 2026
As of H1 2026, the following are the top 3 suppliers of China’s alumina bucket:

Australia – 1.64 million tonnes
Indonesia – 398,764 tonnes
India – 151,965 tonnes
Australia dominated China’s import basket with the lion’s share of 1.64 million tonnes or 72.14 per cent of China’s cumulative import volume. The figure has gone up Y-o-Y by 73.54 per cent, compared to the H1 2025 shipment volume of 94,502 tonnes.
The country has retained the position of the top exporter since Q4 2025, having exported 659,459 tonnes, driven by a thinner domestic inventory cushion in China, prompting an import surge in the quarter.
The sharp rise in Australian shipments can be traced to two developments. First, China received unusually low volumes of Australian alumina during H1 2025, as logistical constraints and unfavourable price spreads limited trade flows.
The picture changed in 2026 as Middle East tensions disrupted established shipping routes, including movements through the Strait of Hormuz.
Some Australian cargoes initially destined for the Middle Eastern market were redirected towards China. At the same time, a more favourable price spread between Chinese and overseas markets opened an arbitrage opportunity, encouraging traders to increase purchases.
Indonesia, occupying the second position, exported 398,764 tonnes and accounted for 17.5 per cent of the cumulative. The volume has surged substantially by 522.38 per cent Y-o-Y from the 64,071 tonnes shipped in H1 2025.
Indonesia is moving to retain more value from its bauxite resources through large-scale downstream investments.
In February 2026, Indonesia’s sovereign wealth fund BPI Danantara launched Phase I of six downstream projects worth about USD 7 billion across 13 locations. The aluminium-focused programme includes a USD 2.4 billion smelter and a USD 890 million smelter-grade alumina refinery in Mempawah, West Kalimantan. The aluminium facility, developed with MIND ID, INALUM and ANTAM, is planned with an annual capacity of around 600,000 tonnes.
The projects come with Indonesia’s push to move beyond raw-material exports and strengthen domestic mineral processing, strengthening its aluminium industry. For the regional alumina market, the expansion could gradually alter trade patterns as Indonesia develops greater capacity to convert bauxite into alumina and aluminium domestically, thereby changing its future role as an exporter to markets like China.
India has emerged as a small but fast-growing alumina supplier to China. Accounting for 6.67 per cent of the cumulative, it exported 151,965 tonnes in H1 2026. The volume has skyrocketed Y-o-Y by 10,984 per cent compared to the mere 1,371 tonnes exported in H1 2025.
India’s alumina exports to China surged specifically as a byproduct of the Gulf conflict’s shipping disruptions, not because of any standalone India-China trade shift.
While India’s growth rate is spectacular, its 151,965-tonne H1 volume remains much smaller compared to the volumes shipped by Australia or Indonesia. Moreover, it appears to be a temporary reroute rather than a structural shift.
Vietnam, in the 2025 calendar, used to remain among China’s top three alumina suppliers. Having exported 51,120 tonnes in Q1 2026 alone, it reflected a drop of 0.88 per cent from the 51,573 tonnes shipped in Q1 and Q2 combined in 2025. However, following the whopping figures, Q2 did not report any alumina shipment from Vietnam to China.
Vietnam’s overall alumina exports have sustained a stark Q-o-Q drop of 99.84 per cent, contracting from 196,606 tonnes shipped in Q1 to merely 313 tonnes exported only to South Korea in Q2.
The sharp decline coincides with Vietnam’s efforts to develop a more integrated domestic bauxite-to-aluminium value chain with its Dak Nong aluminium smelter project, a 450,000-tonnes-per-year facility being developed by NFC and regarded as the country’s first aluminium smelter. The Dak Nong smelter, located in Nhan Co Industrial Park, Lam Dong Province, might propel the dip in Vietnam’s exports as the country strives to build a resilient domestic aluminium supply chain.
Unlock key insights from leading companies and experts across the aluminium ecosystem with our e-Magazine - Mine to Market: Aluminium Producers & Manufacturers 2026
What does the surge mean for China’s alumina market?
China’s H1 2026 alumina trade tells a complicated story. The 749 per cent jump was supported not only by softer international prices and stronger import economics, but also by disrupted Middle East trade routes that redirected cargoes towards China. At the same time, robust domestic alumina production and rising imports have added to inventories, keeping prices under pressure.
As global demand for smelter-grade alumina is projected around 140.6 million tonnes for 2026, slightly under the 2025 levels of 143.5 million tonnes by 2.02 per cent, China’s production capacity forecast to rise 4.22 per cent Y-o-Y from 114.1 MTPA to 118.92 MTPA. For H2 2026, the key question will be whether the extraordinary import momentum can continue once logistics normalise, arbitrage opportunities narrow while new Chinese refining capacity continues to ramp up.

Norsk Hydro restarts Alunorte output after gas deal, expects $75 to 100 million Q3 hit
Next articleAndromeda Metals launches $3m share plan for alumina project
Grow with
AL Circle