Aluminium nears 46Mt, exceeds 45Mt cap? Production growth tests China’s green transition

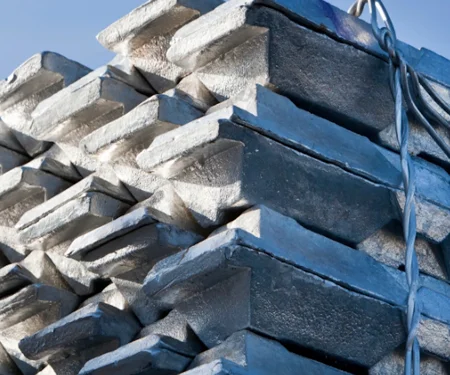
The image used in this article is generated with an AI tool and does not depict any real-time moment
China, the largest producer of primary aluminium on the global platform, continues to raise its annual output despite maintaining a 45-million-tonne production cap. So, what's powering its industry's continued growth?
In the January-June phase or the first half (H1) of 2026, China produced 22.34 million tonnes. Considering historical data, the figure has gone up year-on-year.
H1 2026 – 22.34 million tonnes, up 2.24 per cent Y-o-Y from 21.85 million tonnes in H1 2025
H1 2025 – 21.85 million tonnes, up 2.59 per cent Y-o-Y from 21.3 million tonnes in H1 2024
A clear growth rate is visible over the years as China solidifies its position in the global aluminium production race.
On the flipside, the yearly surge makes way for another vital question to the forefront – If the 45-million-tonne ceiling has been enforced to limit the production-induced carbon emission, how is China successfully achieving a boost in its production volume every year?
_0_0.png)
China’s 2025 production volume stood at 45.02 million tonnes, just over the stipulated ceiling. While H1 produced 21.85 million tonnes, H2 recorded a higher growth rate, with production reaching 23.17 million tonnes.
H1 results tend to be weaker for the Chinese aluminium industry due to the smelter maintenance in January to February, followed by the Chinese New Year’s break in March.
Hence, the uninterrupted production trend gave it a boost by about 2.38 per cent during H2.
However, taking these factors into account, if the H2 2026 production also maintains a rising trend as in the previous year, then the 6.04 per cent gain added to its approximate H2 production of 22.34 million tonnes (as per the H1 data), the full H2 number would amount to 23.69 million tonnes.
This would take the annual production cumulative to 46.03 million tonnes, exceeding the production ceiling by 0.5 per cent, which, according to the nation’s output trend, is likely to keep surging.
Ideally, if production was capped at 45 million tonnes, then the monthly output average would remain around 3.7 million tonnes.
Explore the relevance of red mud in the sustainable aluminium industry in A Comprehensive Analysis of Bauxite Residue (Red Mud): Sustainability, Resource Recovery and Strategic Recommendations
China’s offshore aluminium shares
Apart from these, China’s offshore shareholdings have also left a footprint on the global aluminium market. Some of these are reportedly in talks but are yet to be confirmed.
Indonesia
- Tsingshan Group & Huafon Aluminium – Planned capacity of 1 million tonnes per annum (MTPA) with 500,000 tonnes of new expansion, within the Huaqing Aluminium, Morowali Industrial Park.
- Nanshan Aluminium International Group – The Bintan Nanshan Industrial Park is reported to reach 1 MTPA capacity, with an additional 250,000-tonne electrolytic aluminium smelter under expansion. Commissioning might be delayed till 2027.
- Alamtri Resources [formerly Adaro Group] & Zhejiang Lygend – The Kaltara project is planned to achieve 1.5 MTPA, comprising 500,000 tonnes existing and 1 MTPA of additional capacity, powered largely by hydropower.
- Xinfa Group and Tsingshan Group – Expansion plans of Juwan aluminium smelter within the Indonesia Weda Bay Industrial Park (IWIP) to 500,000 tonnes, including 250,000 tonnes of new production.
- East Hope Group – Westerfield, one of Indonesia's largest planned aluminium projects, targeting 2.4 MTPA of smelting capacity upon completion.
Angola
- Hebei Huatong Wire & Cables Group – Established and commissioned in January 2026 the Huatong Electrolytic Aluminium Production Line project in Angola, the country's first large-scale aluminium smelter with an annual production capacity of 120,000 tonnes.
- China CAMC Engineering Jiangsu and China National Machinery Industry Corporation (SINOMACH) – Involved in the engineering design, equipment procurement, installation and operational readiness for the Phase II expansion of the Huatong project, adding a further 120,000 tonnes to smelting capacity, taking it to 240,000 TPA.
Saudi Arabia
- Shandong Innovation Group– In partnership with Saudi Arabia’s PIF, leads the Saudi Red Sea Aluminum Industry Chain Comprehensive Project to establish an integrated aluminium park, aimed at a 500,000 TPA production capacity.
- Hangzhou Jinjiang Group – A proposed 1 MTPA aluminium smelter in Jazan, expected to benefit from the region's integrated industrial infrastructure and energy availability.
Kazakhstan
- East Hope Group project – Plans to build a 1 MTPA aluminium smelter worth USD 12.6 billion.
These projects and initiatives reflect China's efforts to keep carbon emissions under control without exceeding its 45-million-tonne aluminium production cap within the country. However, they do not eliminate the broader challenge of reducing emissions associated with primary aluminium production.
China's aluminium smelting energy mix
According to the data accumulated by the International Aluminium Institute, as of 2024, these are the various energy sources used in China’s primary aluminium production:
- Coal – 402,820 GWh or 34.5 per cent
- Self-generated – 330,895 GWh or 28.4 per cent
- Purchased from supplier(s) – 252,694 GWh or 21.6 per cent
- Hydro – 113,294 GWh or 9.7 per cent
- Other renewable sources – 59,536 GWh or 5.1 per cent
- Nuclear – 7,939 GWh or 0.7 per cent
Thus, the lion’s share of energy used in China’s aluminium production is taken up by coal, thereby renewing the concern about how the industry would continue to increase production while adhering to the production cap and keeping carbon emissions in check.
China has been adopting initiatives to increase the share of renewable energy sources in China’s industrial energy mix and push the nation’s industrial setup towards a green future.
Keeping this in mind, China's 15th Five-Year Plan (2026-2030) is designed to support high-quality economic development while advancing China's long-term objectives of peaking carbon emissions before 2030 and achieving carbon neutrality by 2060. It prioritises the following factors:
- Reduce carbon intensity: China aims to cut CO₂ emissions per unit of GDP by 17 per cent between 2026 and 2030, supporting its carbon peaking and long-term carbon neutrality goals.
- Scale up clean energy deployment: Continued expansion of renewable energy with solar and wind is aimed at contributing 30 per cent of the energy mix. A 100GW of pumped hydropower storage is also planned to strengthen energy security and reduce reliance on imported fossil fuels.
- Accelerate zero-carbon industrial parks: The government plans to establish zero-carbon industrial parks, supplying industries with clean electricity and green hydrogen to decarbonise manufacturing operations.
- Expand grid infrastructure: Investment will continue in ultra-high-voltage (UHV) transmission networks to connect western renewable energy bases with eastern demand centres and improve renewable integration.
- Promote green fuels and electrification: The plan supports wider adoption of green hydrogen, electrification and other low-carbon technologies across heavy industry.
- Continue nuclear expansion: China plans to increase installed nuclear capacity to around 110 GW by 2030, with development remaining concentrated in coastal provinces.
Unlock key insights from leading companies and experts across the aluminium ecosystem with our e-Magazine - Mine to Market: ALuminium Producers & Manufacturers 2026
According to the National Bureau of Statistics (NBS) of China, Electricity generation by industrial enterprises above designated size reached 3.91 trillion kWh during January-May 2026, up 3.6 per cent year-on-year. Within this growth, renewable power generation outperformed most of China’s conventional sources.
Hydropower generation increased by 13.0 per cent Y-o-Y in May 2026, the strongest growth among all major power sources.
Solar power generation grew 12.1 per cent year-on-year in May 2026, up from 7.1 per cent in April.
Wind generation gained 0.5 per cent in May, marking a return to positive growth after a 5 per cent decline in April.
Nuclear generation also recovered with a 5 per cent surge in May, from the 8.7 per cent decline in April as maintenance-related disruptions eased.
Thermal power, predominantly coal-fired, is growing at a much slower pace. Rising only 2.1 per cent in May, growth remained modest compared with hydropower and solar, thereby showing a clear deceleration over the period.
China's aluminium industry appears to be walking a fine line between expanding output and pursuing decarbonisation. While the renewable energy transition is gaining pace, coal still dominates the power mix for primary aluminium production. Whether clean energy can meaningfully reduce the sector's carbon footprint while supporting rising output within the 45-million-tonne cap remains a question that only the coming years will answer.
LME aluminium price climbs to USD 3,183.5/t on July 21; alumina Platts price up 0.79%
Next articleAluminium losses narrow 48% as Steel Dynamics Q2 revenue jumps 33%
Grow with
AL Circle