According to data from the US Geological Survey, the United States' imported 1.34 million tonnes of alumina in 2024, showing a slight decline from 1.36 million tonnes in 2023. This year-on-year dip occurred despite Australia emerging as one of the top suppliers of the ore to the US starting in the third quarter of the year.
Quarterly performance: a mixed bag
The United States’ alumina imports saw back-to-back growth in the second and third quarter of 2024, amounting to 325,000 tonnes and 378,000 tonnes, respectively. It was in Q4 when the import volumes decreased by 7 per cent Q-o-Q to 352,000 tonnes, offsetting the 16 per cent growth in the previous two quarters. Even on an annual basis, the imports in Q4 dropped by 2 per cent from 359,000 tonnes to 352,000 tonnes.
Similarly, the imports in Q1 were 20.33 per cent down Q-o-Q and 11.46 per cent less Y-o-Y compared to 359,000 tonnes of imports recorded in Q4 2023 and 323,000 tonnes in Q1 2023. However, the 16 per cent sequential increase in the second and third quarter each helped mitigate the annual declining rate of the United States’ alumina imports.
Why the drop occurred? Analysing trade dynamics between US & its partners
To understand the decline in U.S. alumina imports in 2024—despite Australia’s return as a major exporter—it is important to examine trade flows with the country’s main alumina partners throughout the year.
Let’s focus on Brazil first who is the largest supplier of alumina to the United States. Brazil in the first quarter of 2024 exported 219,000 tonnes of alumina to the US. The export volumes were 29 per cent down Q-o-Q from 305,000 tonnes and 19 per cent less Y-o-Y than 269,000 tonnes, showed USGS data. In the subsequent quarter, the export volume increased to 273,000 tonnes but again plunged to 257,000 tonnes in Q3 and further to 220,000 tonnes in Q4, coming back to the level of Q1. The two consecutive quarterly declines resulted in the total exports of 969,000 tonnes at the end of 2024, down by 14 per cent from 1.13 million tonnes in 2023. As the largest supplier, Brazil’s reduced volumes had a significant impact on overall US import figures.
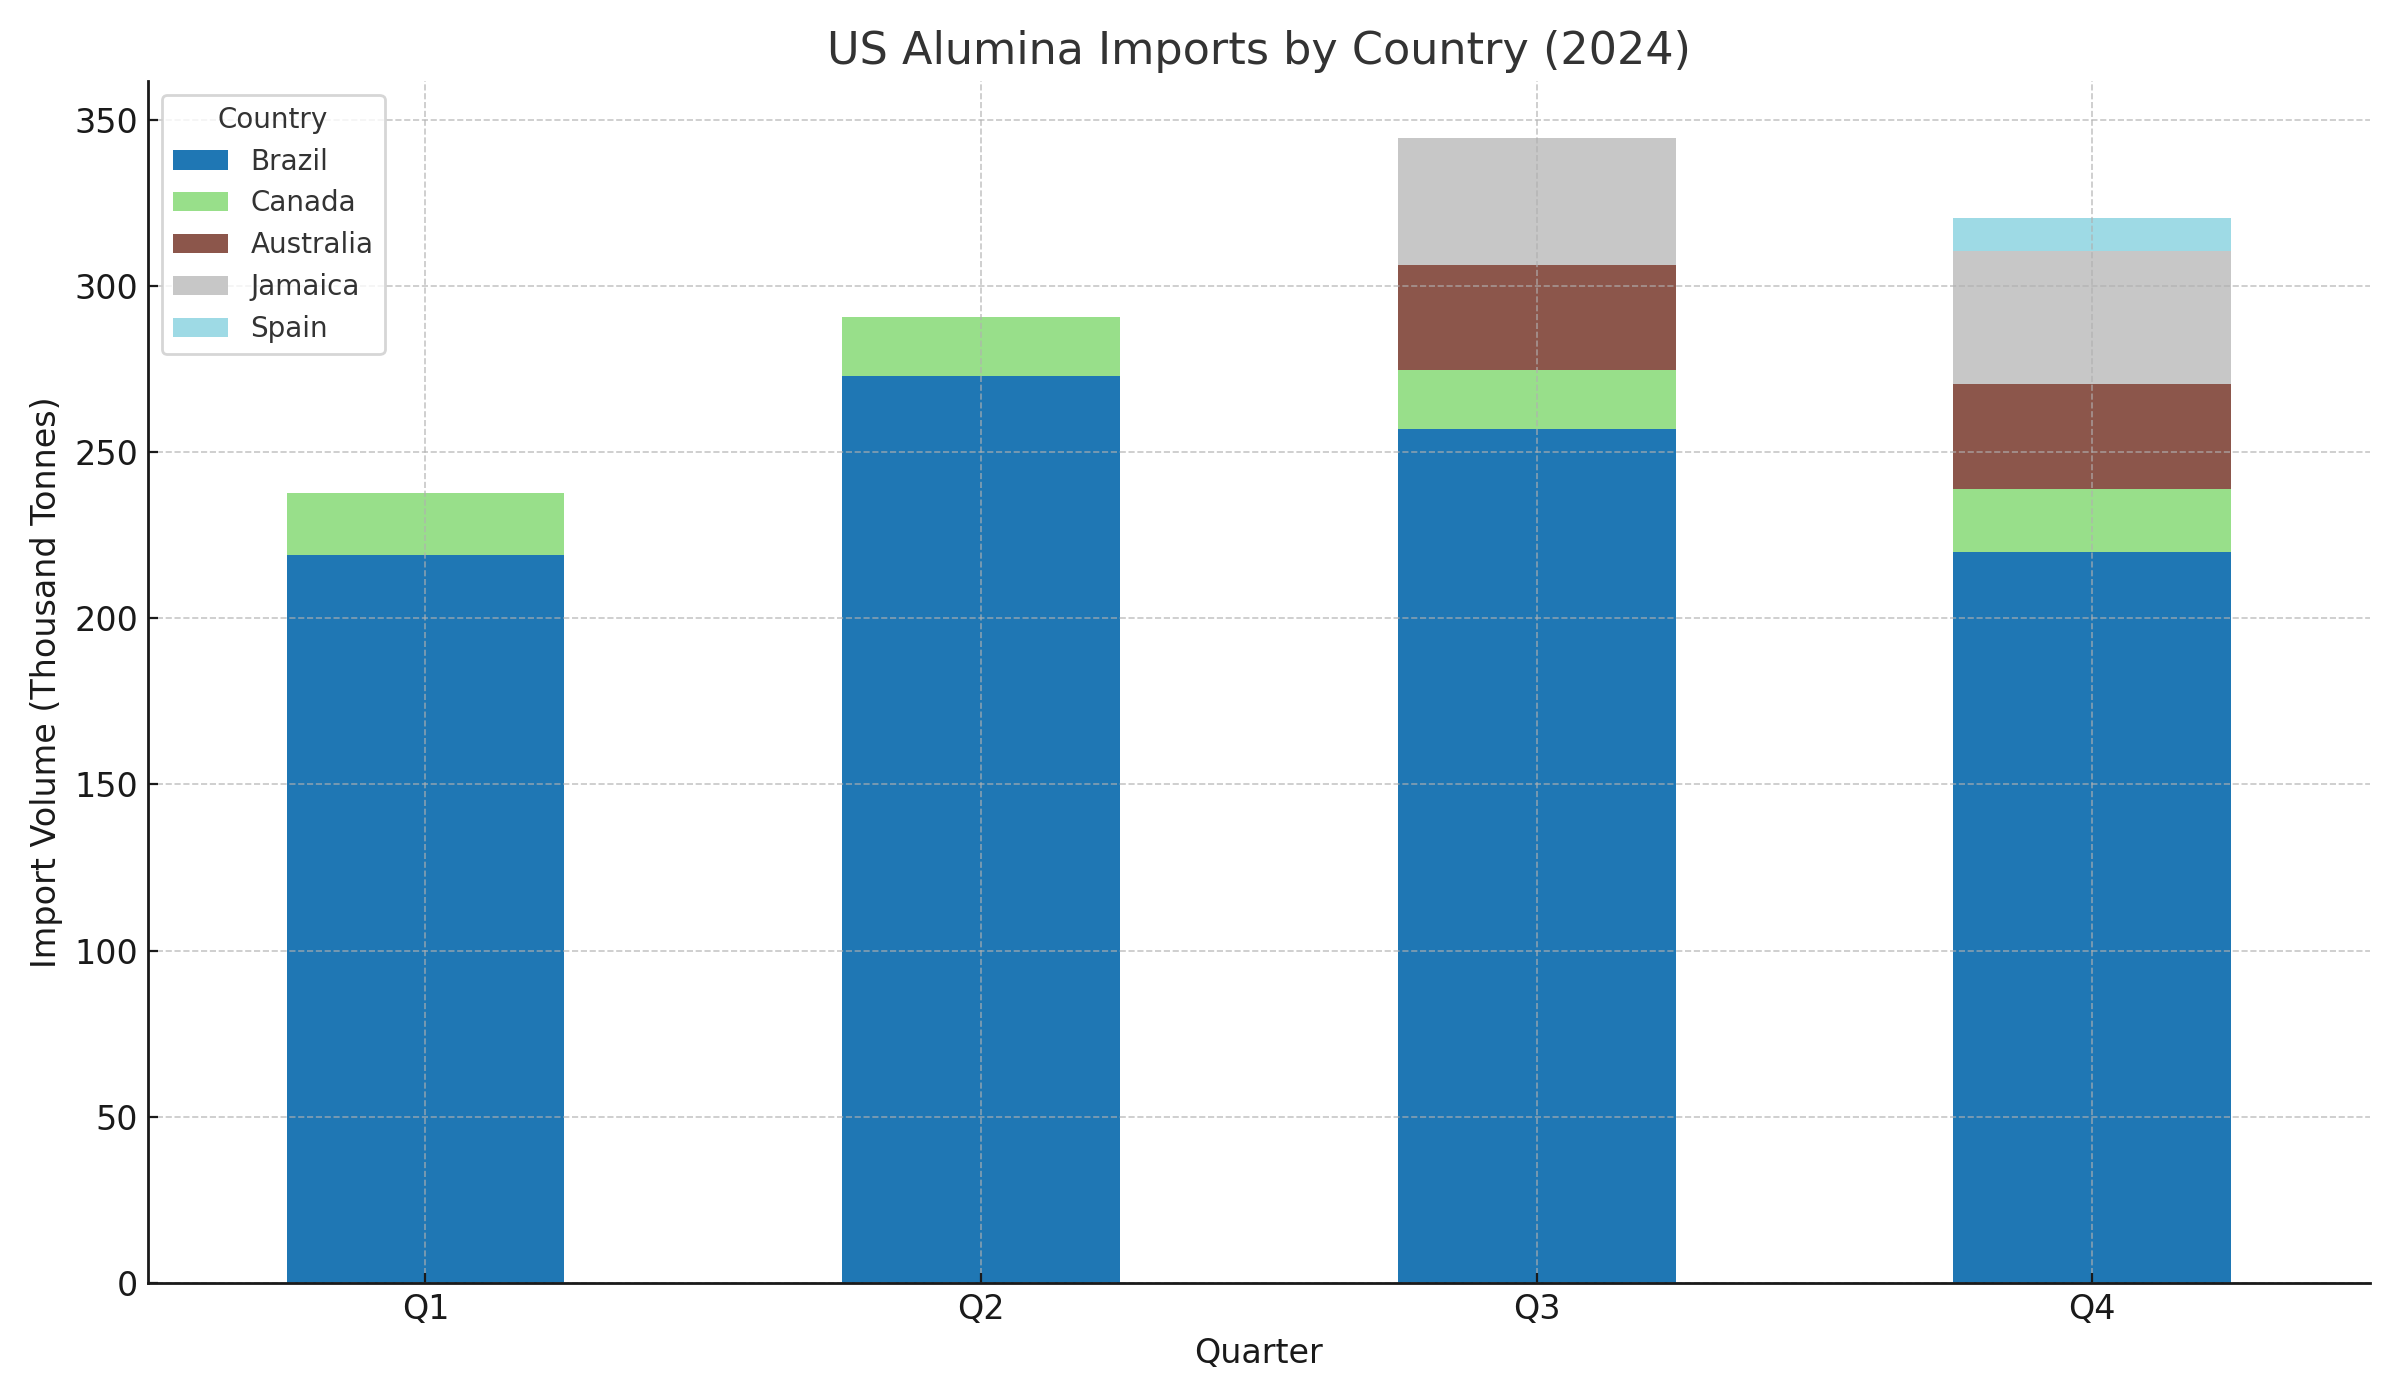
The next decline was seen in Canada’s supply from 79,100 tonnes in 2023 to 72,900 tonnes in 2024. After a slight sequential rise in Canada’s alumina exports to the US in Q1 from 18,100 tonnes to 18,700 tonnes, Canda’s alumina exports in Q2 decreased to 17,600 tonnes and stood restrained in the subsequent month at 17,700 tonnes. Although it finally revived in Q4 to 18,900 tonnes, it remained insufficient to mitigate the losses in the previous two quarters.
Apart from Brazil and Canada, exports from Australia, Jamaica, and Spain increased in 2024 but only in the latter half of the year. Australia’s alumina exports to the US increased significantly in Q3 from the minimal 138 tonnes in Q2 to 31,600 tonnes and remained steady in Q4 at 31,500 tonnes. Exports from Jamaica also ramped up exports, sending 38,100 tonnes in Q3 and 39,900 tonnes in Q4. Spain followed suit, with Q4 exports surpassing 10,000 tonnes, up from just 59 tonnes in Q3 and 44 tonnes in Q1 2023.
The data above indicates a mixed picture. While Australia’s resurgence as a major supplier and Jamaica and Spain’s growing shipments signal stronger trade relationships and diversification, Brazil’s significant decline as the largest source plays a decisive role in pulling down overall import volumes.
If emerging suppliers like Australia, Jamaica, and Spain continue their upward trend, and Brazil stabilizes or boosts its export volumes, the U.S. could see a more balanced and potentially growing alumina import market in the near future.











_md.webp)
_md.webp)
_md.webp)