The past week has been all about the dynamic shift driven by rising domestic prices, US tariff policies, and fluctuating supply-demand dynamics in the global aluminium market. According to various news platforms, Chinese aluminium spot prices have hiked to RMB 20,524 per tonne (USD 2,862 per tonne) in South China, followed by RMB 20,504 per tonne (USD 2,859 per tonne) in East China. Both the regions were separately up 1.67 per cent and 1.65 per cent week-on-week.
This increase was fuelled by a 0.84 per cent gain in LME prices to USD 2,636 per tonne, trending higher by 1.51 per cent week-on-week along with stronger downstream demand.
Meanwhile, a potential speed-breaker looms as the US, under the Trump administration, has imposed a 10 per cent tariff from February and intends to slap another 25 per cent tariff on all Chinese aluminium imports (as part of global import). Analysts have predicted that this policy is threatening a decrease in Chinese exports to the North American nation, subsequently leading to a reduction in the US market supply, and driving up domestic US prices.
Market dynamics and outlook: Volatility with geopolitical risks
Aluminium producers in China saw profits surge due to falling alumina costs, which dropped 9.19 per cent W-o-W to RMB 3,535.89 per tonne (USD 493 per tonne). Yet, continuous price declines are tightening margins for alumina suppliers, signalling possible supply adjustments ahead.
Petroleum coke prices skyrocketed 32.94 per cent W-o-W to USD 461 per tonne amid tight supply. Despite cost pressures from upstream materials, prebaked anode prices held steady at USD 673 per tonne, supported by consistent demand from aluminium smelters.
Market analysts project that China’s aluminium spot prices may shift downward next week, averaging RMB 20,000-21,000 per tonne (USD 2,789-2,928 per tonne), citing market volatility and inventory pressures. Additionally, the US tariff threat could spark retaliatory trade actions, reshaping global aluminium trade flows.
Aluminium: Import vs. export
The consolidated data reveals a significant disparity between China’s aluminium imports and exports in 2024. While the country imported humungous volumes of aluminium throughout the year, its exports remained considerably lower both in terms of quantity and value.
- Imports:
China’s aluminium imports consistently remained high throughout the year, ranging from a high of 247,705 tonnes in January to a low of 121,221 tonnes in June. The import value followed a similar trend, with a minimum of USD 311.44 million in June and a maximum of USD 579.53 million in January.
- Exports:
In contrast, China’s aluminium exports were inferior. Export quantities varied from a low of 56 tonnes in February to a high of 18,947 tonnes in July. The export value mirrored this pattern, with a minimum of USD 135 thousand in February and a maximum of USD 456.6 million in July. The comparatively smaller export volumes suggest that China’s domestic aluminium production largely caters to its internal market needs, with only a limited surplus allocated for export.
Alumina: Import vs export
The import and export volumes and values of alumina in China from January to December 2024 show both highs and lows present on the trade front in terms of volumes and values throughout the year.
- Imports
Alumina imports to China varied considerably. January showed the highest import volume (351,293 tonnes), followed by a decrease in February and March. April experienced a sharp drop. May also showed relatively low import volumes, while July registered a rebound. Subsequently, August and October witnessed the lowest import quantities (6,298 tonnes and 6,253 tonnes, respectively), before a noticeable increase in November. December again dropped with the third lowest import volume of the year (15,289 tonnes).
The import value generally followed the trend of the import volume. January registered the highest import value (USD 136.69 million), mirroring the high volume. Significant drops occurred in April and May, correlating with the lower import quantities. The value rose in July and then experienced another decrease in August and October. November saw an increase in value, consistent with the volume increase, before falling again in December.
- Exports:
China’s alumina exports also demonstrated volatility. While January and February showed relatively similar export volumes (138,288 tonnes and 139,216 tonnes), March showed a further increase. April and May showed a decrease compared to the preceding months. June saw a significant increase. December saw the second-highest export, with 188,317 tonnes, while in November, China exported 191,340 tonnes.
The export value didn’t consistently align with the export volume. Even with fluctuating volumes, the export value remained relatively high throughout the year.
Strategic insights for investors and industry leaders:
- Monitoring US-China trade developments as potential tariffs could disrupt exports and increase US prices.
- Assessment of cost dynamics wherein falling alumina prices benefit producers but then may potentially trigger supply cuts.
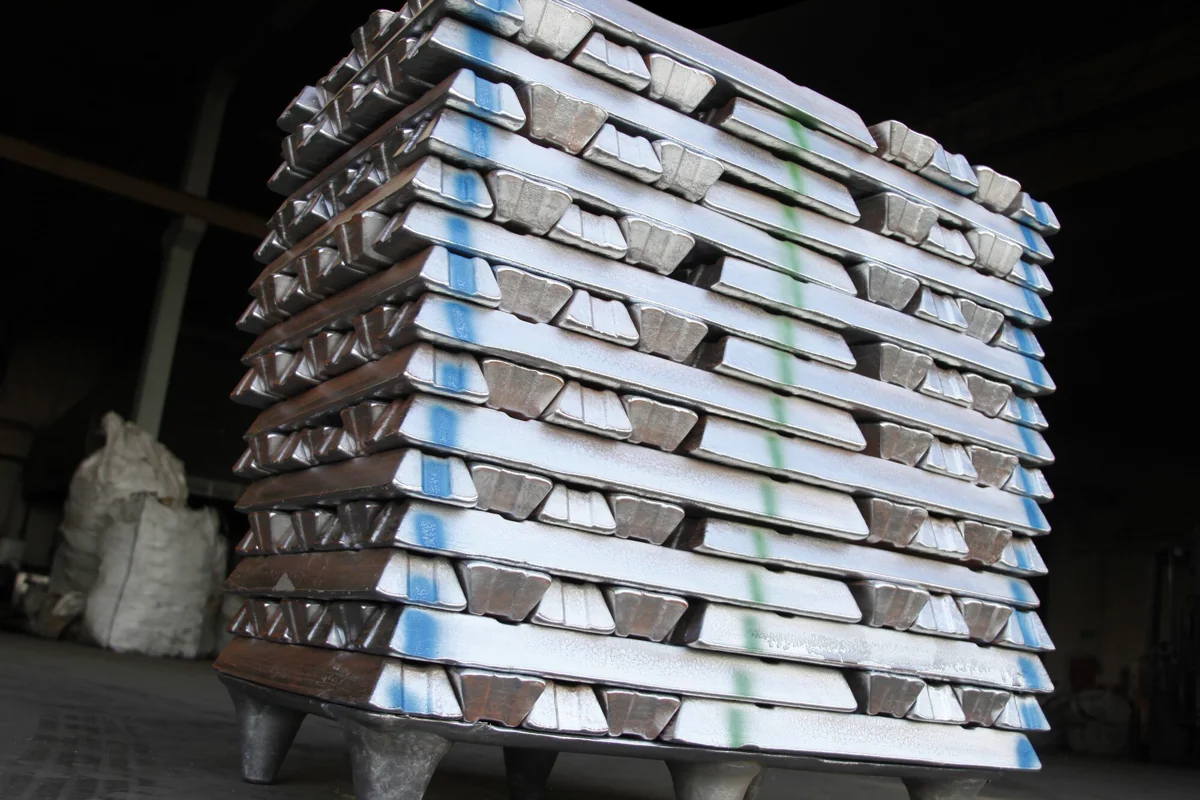
- Industry investors need to keep an eye out for inventory trends, especially with the rising aluminium ingot stocks in China, which may pressure spot prices.
The Chinese aluminium market stands at a crossroads, shaped by economic, geopolitical, and supply chain forces. Industry participants should remain agile to navigate the evolving landscape.
N.B: Information collected from various media research platforms