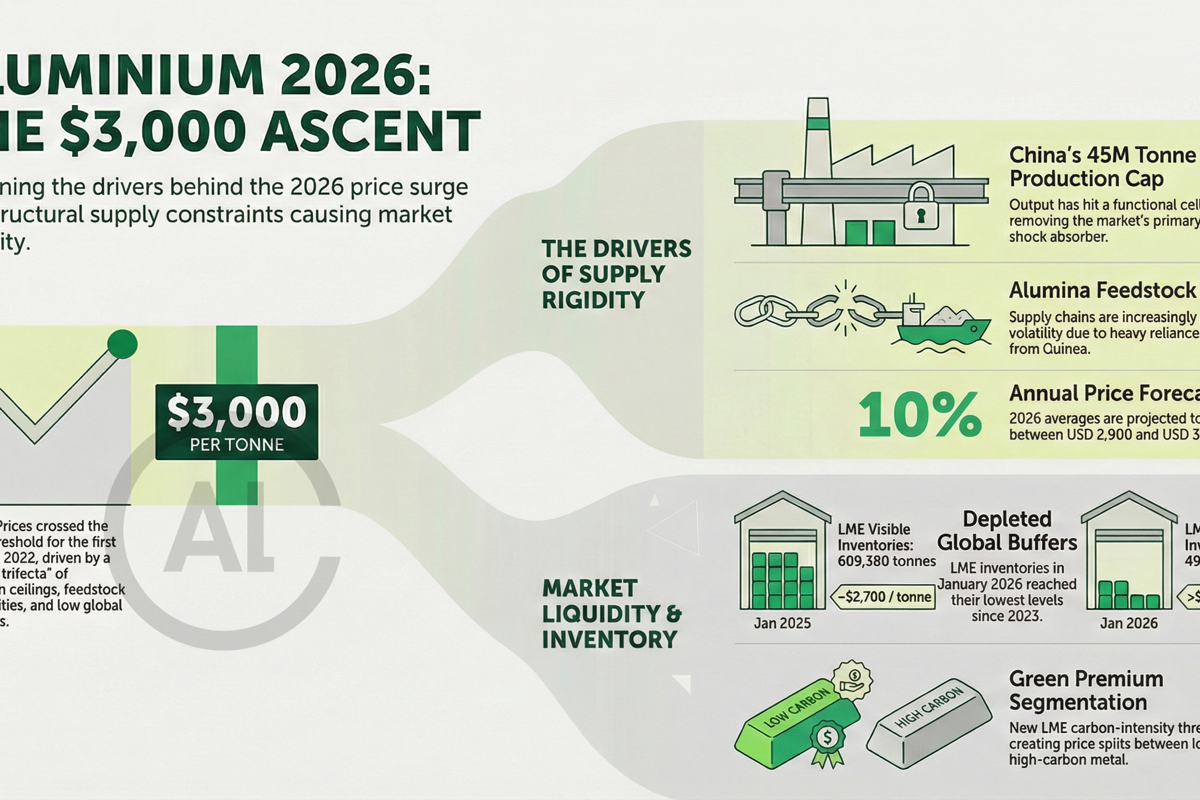
The London Metal Exchange (LME) aluminium contract entered 2026 with a bang of a hike, as in early January, the three-month contract crossed USD 3,000 per tonne for the first time since 2022, trading at USD 3,015.50 before extending gains later in the month. The move was not the product of speculative momentum alone. Back in 2022 production and energy costs, China’s production cap and Russia-Ukraine’s war imparted their fair share of spices into the price hike scenario. But this time, it reflected a convergence of constrained supply, tightening physical availability and US and EU’s policy-driven rigidity, consequently leading to altered price expectations for the rest of 2026.
Is the previous forecast annulled?
PricePedia’s December 9, 2025 publication put the 2026 outlook clearly in bullish territory, estimating roughly a 10 per cent rise in USD prices for the year versus the previous calendar year (2025).
The forecast places the expected annual average well above the mid-USD-2,700s that characterised much of last year. While PricePedia’s analysis extends beyond 2026, the first year of that outlook now warrants isolated attention. January’s price action has already validated the assumption that the aluminium market is entering 2026 without surplus capacity to dampen shocks.
Two sets of contemporary market signals explain why 2026 looks constricted and justify focusing the forecast on that single year. The first is supply rigidity centred on China and the alumina feedstock chain.
The first signal: China’s production ceiling removes the market’s shock absorber
At the core of the tightening narrative lies China’s production ceiling. Primary aluminium output in China nudged past 45 million tonnes in 2025, a level widely understood by producers, traders and policymakers as a functional cap rather than a soft guideline.
Primary aluminium output in China rose by approximately 2.7 per cent Y-o-Y to 44.4 million tonnes. But by the government limitation standards, the output must not go any higher. Thus, unlike earlier cycles, when Chinese smelters could respond rapidly to higher prices, the current framework limits incremental output growth. Energy constraints, emissions compliance and regional policy enforcement have combined to remove the market’s most powerful supply lever, China, from adjusting onshore output any further.
The ongoing calendar year will see China’s cap matter more than headline demand growth, because it narrows the scope for mitigating the global demand-supply gap anytime with heightened output.
Don't miss out- Buyers are looking for your products on our B2B platform
Alumina emerges as a structural pressure point
The constraint does not end at primary aluminium. Alumina, the critical feedstock, has emerged as a pressure point rather than a transient bottleneck.
Data presented by Mark Roggensinger, Head of Market Analysis, Hydro Bauxite & Alumina, at ARABAL, shows that world ex-China alumina supply remains vulnerable to disruption, with five-year average outage volumes running into the hundreds of thousands of tonnes annually.
While new refinery capacity is planned in Indonesia and India, industry analysis highlights wide uncertainty bands around ramp-up timelines and utilisation rates. Delays of even a few months materially affect primary aluminium output in a market already operating with thin buffers.
The Hydro-presented data also highlights that Guinea’s share of China’s bauxite imports has risen sharply, making supply chains more exposed to political, logistical and pricing volatility. Import price variability has increased alongside this concentration, reinforcing the fragility of the upstream segment feeding global aluminium production. For aluminium price outlook 2026, this means that alumina availability is not simply a background variable. It is a swing factor with direct pricing consequences.
The second signal: How has the inventory behaviour been so far?
The second corroborating signal is the physical liquidity and inventory picture. The physical aluminium market is reflecting these constraints with unusual clarity. LME visible inventories stood at an average of 498,670 tonnes in January 2026, well below the previous year’s January numbers of 609,380 tonnes. The inventory volume registered in the first month of 2026 are lowest ever since 2023.
The front end of the LME price curve in 2026 is carrying a considerable premium to later months, reflecting immediate physical tightness. Trading platforms and market aggregators recorded intra-month three-month prints above USD 3,000, and the front end continued to trade with little tolerance for large negative supply shocks.
Must read: Key industry individuals share their thoughts on the trending topic
The two concrete, data-driven forecast scenarios
Here’s why that physical tightness is likely to persist through 2026 unless a clear pipeline of commissioned capacity arrives.
First, world ex-China alumina refinery additions are visible in the data but geographically concentrated and, in many cases, exposed to higher greenhouse-gas intensity and bauxite-cost sensitivity.
The projected cost curve shows significant dispersion in refinery GHG intensity and indicates that new Indonesian refinery capacity does not materially support decarbonisation objectives while being uncertain in timing and throughput.
Second, Guinea’s growing share of China’s bauxite imports has increased supply vulnerability: Hydro’s charts show Guinea rising to dominate China’s import flows and a correlated rise in import price volatility. Both factors make the alumina-to-primary aluminium bridge fragile in the near term and add to the probability of a 2026 deficit scenario if demand holds.
On the market-structure side, LME governance and physical market settings ratchet in support for price discovery and premia development that are relevant to 2026 pricing. The LME’s ARABAL presentation documents expanded warehousing coverage, the rollout of LMEpassport disclosures and new measures to price sustainable concrete emissions thresholds.
The LME’s quartile analysis of disclosed emissions
Simultaneously, LME data shows a central carbon-intensity band at roughly 10 tonnes of CO2e per tonne (50th percentile), with the 25th percentile near 4.25 tonnes of CO2e per tonne of aluminium and the 75th percentile around 13.5 tonnes of CO2e per tonne.
The LME is explicitly using 10 tonnes of CO2e per tonne of aluminium threshold as a reference point for sustainability premia.
That transparency creates an added layer of segmentation in 2026 between lower-emissions, premium-priced brands and higher-intensity, discount-sensitive volumes. This bifurcation reduces fungibility at the delivery grade and supports tighter effective physical availability for lower-carbon metal.
Factors to look out for in the coming quarters
The immediate cash and three-month prints above USD 3,000 at the start of January constitute a contemporaneous market signal that front-end risk is priced. PricePedia’s 10 per cent 2026 rise hypothesis is consistent with the combination of:
(b) a tight and disruption-prone world ex-China alumina market with uncertain refinery ramp timing in Indonesia and India,
(c) diminishing visible LME stocks that provide less shock absorption, and
(d) structural segmentation on sustainability and sanction-related premia which reduces the pool of deliverable, low-carbon metal.
Both outcomes are quantifiable
Quantitatively, if average 2025 LME pricing sat in the mid-to-low-USD-2,700s, a 10 per cent uplift for 2026 would imply an annual average in the high-USD-2,900s to low-USD-3,100s — a range that aligns with January 2026 front-end trading and with market forward curves observed at month-end.
Risk calibration for a 2026-only forecast must remain tight and numeric. The primary upside to this 2026 baseline is sharper-than-expected alumina and primary aluminium export curtailments from China or additional unplanned closures in major ex-China refineries, which would push a 2026 annual average materially above USD 3,200 per tonne. The primary downside remains faster ramping of Indonesian primary capacity and ex-China refineries delivering SGA (soda-derived alumina) into the market sooner than current schedule assumptions.
Hydro’s internal ramp scenarios display a wide range (Indonesia alumina balance forecast range in their slides is roughly 1.1-1.8 million tonnes in the medium term), and a realisation toward the high end would shave several hundred dollars per tonne from the front end by late 2026.
A surprise 0.5-1.0 tonne of incremental alumina/aluminium ex-China in 2026 would exert downward pressure in the low-hundreds USD per tonne; a set of further supply shocks totalling 0.5 tonne of lost availability would lift the average into the greater than USD 3,200-3,400 per tonne band.