Asian aluminium bar, rod, profile trade: Vietnam tracks China’s 18% dip as Malaysia gains 21%
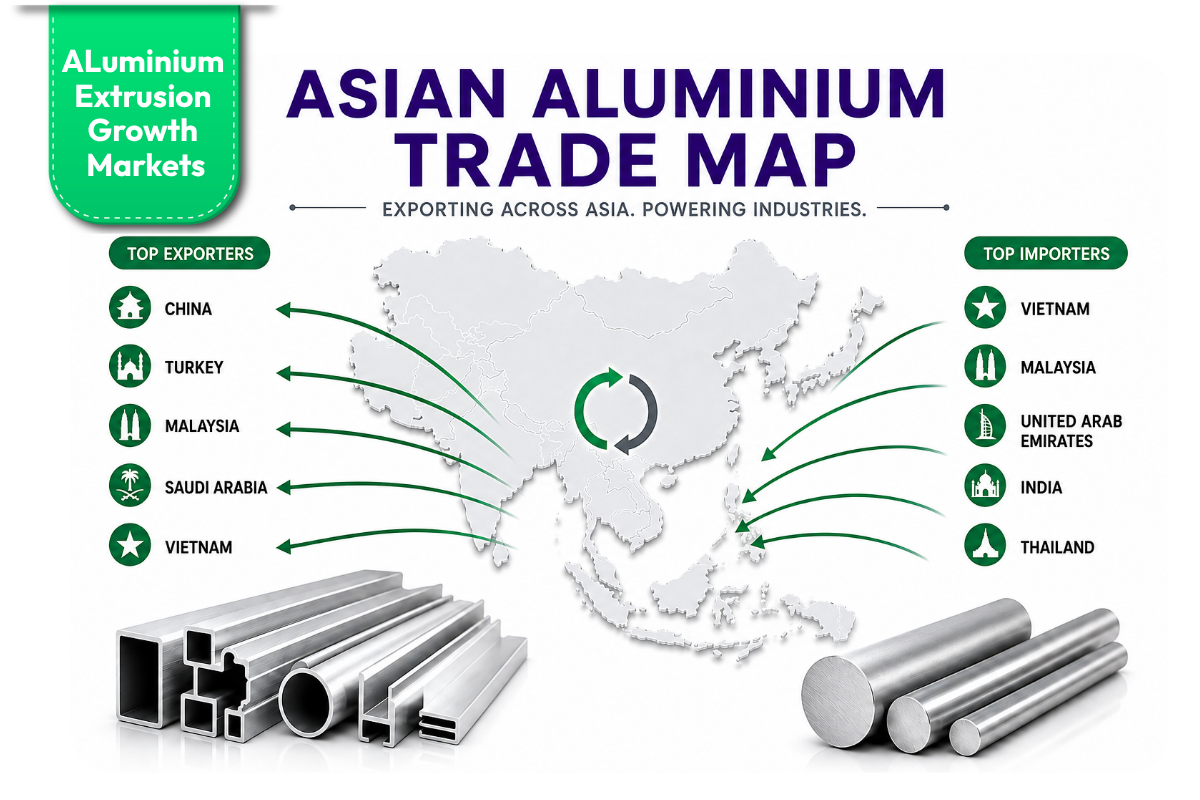
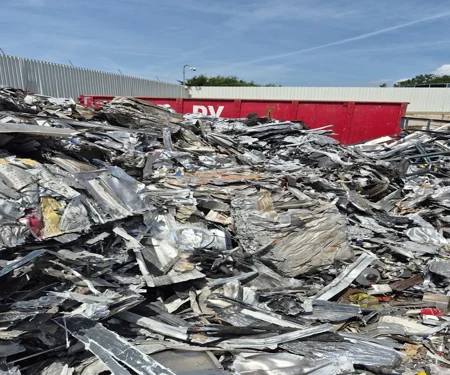
The image used in this article is generated with an AI tool and does not depict any real-time moment
As global demand for value-added aluminium products continues to rise across construction, automotive, renewable energy, electrical equipment and industrial manufacturing, aluminium bars, rods and profiles have become one of the most actively traded downstream products. Asia remains at the crucial juncture of this trade, serving both as the world’s largest production hub and one of its biggest consumption markets.
Shaping this market from both the supply and demand sides, ten key Asian economies have gained prominence. On the export front, China, Turkey and Saudi Arabia emerged as the region’s top suppliers. On the import side, the United Arab Emirates (UAE), India and Thailand ranked as the leading buyers. Meanwhile, Malaysia and Vietnam appear on both supplying and sourcing lists.
A closer look at the latest trade data reveals the Asian economies that are leading exports and imports, and how their trade patterns are changing.
Amongst the Asian exporters of aluminium bars, rods and profiles, the following 5 countries lead the race with the highest export figures:
China
In 2025, the category of aluminium bars, rods and profiles accounted for 14.54 per cent of China’s total 6.13 million tonnes of export of all products, including unwrought aluminium, foil, pipes and tubes, plates, sheets and strips, tubes or pipe fittings, and wire.
China leads, although with a significant year-on-year dip in export volume.
2025 vs 2024 – 890,733 tonnes 1.09 million tonnes, down 18.28 per cent from a year ago
However, as of year-to-date figures, the YTD May exports have improved.
- YTD May 2026 – 355,373 tonnes, up 4.26 per cent Y-o-Y
- YTD May 2025 – 340,842 tonnes, down 19.28 per cent Y-o-Y
- YTD May 2024 – 422,267 tonnes
As of 2025, top buyers from China have been Vietnam, Malaysia, Nigeria, Australia and South Africa.
China’s tax rebate cancellation may have directly catalysed the Y-o-Y annual export dip in 2025. However, surging aluminium prices driven by the Middle East conflict, fuelled by a tax gap across the Strait of Hormuz, prompted Chinese producers to ramp up supply of aluminium in processed or semi-fabricated form rather than as ingots. Hence, the YTD export figures have improved year-on-year.
Unlock in-depth insights into the extrusion segment of the global aluminium industry with The World of Aluminium Extrusions – Industry Forecast to 2032
Turkey
In 2025, the category of aluminium bars, rods and profiles accounted for 40.63 per cent of Turkey’s total 983,897 tonnes of export of all products, including unwrought aluminium, foil, pipes and tubes, plates, sheets and strips, tubes or pipe fittings, and wire.
Turkey exhibits a strong annual export growth rate.
2025 vs 2024 – 399,712 tonnes vs 375,512 tonnes, up 6.44 per cent from a year ago
However, as of year-to-date figures, the YTD May exports depict a decline.
- YTD May 2026 – 145,369 tonnes, down 10.17 per cent Y-o-Y
- YTD May 2025 – 161,831 tonnes, up 5.33 per cent Y-o-Y
- YTD May 2024 – 153,638 tonnes
As of 2025, top buyers from Turkey have been Germany, Iraq, Poland, the Netherlands and the US.
Turkey’s semi-finished aluminium exports are being squeezed by CBAM exposure, price pressure, and limited feedstock availability, while domestic demand continues to grow.
Join the webinar by Alberto Monje Gama to learn about recycled aluminium, CBAM and trust
Malaysia
In 2025, the category of aluminium bars, rods and profiles accounted for 3.84 per cent of Malaysia’s total 2.23 million tonnes of export of all products, including unwrought aluminium, foil, pipes and tubes, plates, sheets and strips, tubes or pipe fittings, and wire.
Ranking third, Malaysia’s exports have reported steady annual growth.
2025 vs 2024 – 85,659 tonnes vs 75,244 tonnes, up 13.84 per cent from a year ago
Similarly, the estimated YTD May 2026 export figures have maintained an upward trajectory.
- Estimated YTD May 2026 – 35,601 tonnes, up 16.02 per cent Y-o-Y
- Estimated YTD May 2025 – 30,686 tonnes, down 2.82 per cent Y-o-Y
- Estimated YTD May 2024 – 31,575 tonnes
As of 2025, top buyers from Malaysia have been Mexico, Canada, Singapore, the US and the United Kingdom.
Malaysia’s market is supported by a large domestic aluminium base, and Press Metal remains the region’s largest integrated producer, helping sustain export volumes. Malaysian aluminium from hydro-powered operations embedding a lower-carbon input is providing a competitive edge in western markets as carbon rules tighten.
Saudi Arabia
In 2025, the category of aluminium bars, rods and profiles accounted for 15.93 per cent of Saudi Arabia’s total 523,089 tonnes of exports of all products, including unwrought aluminium, foil, pipes and tubes, plates, sheets and strips, tubes or pipe fittings, and wire.
Over the years, Saudi Arabia has seen exponential growth in its export portfolio.
2025 vs 2024 – 83,304 tonnes vs 50,222 tonnes, up 65.87 per cent from a year ago
The upward trend is also starkly visible in the estimated YTD May export figures.
- Estimated YTD May 2026 – 40,550 tonnes, up 32.1 per cent Y-o-Y
- Estimated YTD May 2025 – 30,700 tonnes, up 98.28 per cent Y-o-Y
- Estimated YTD May 2024 – 15,500 tonnes
As of 2025, top buyers from Saudi Arabia have been the UAE, Egypt, Oman, Kuwait and Jordan.
Saudi Arabia’s resilience as the fastest-growing exporter indicates the Gulf’s expanding downstream aluminium processing capacity.
Vietnam
In 2025, the category of aluminium bars, rods and profiles accounted for 32.14 per cent of Vietnam’s total 207,490 tonnes of exports of all products, including unwrought aluminium, foil, pipes and tubes, plates, sheets and strips, tubes or pipe fittings, and wire.
Although still ranking among the top five Asian exporters, Vietnam has seen a stark Y-o-Y dip in its shipment volumes.
2025 vs 2024 – 66,689 tonnes vs 82,867 tonnes, down 19.52 per cent from a year ago
The declining trend has persisted in the estimated YTD May 2026 export figures.
- Estimated YTD May 2026 – 20,085 tonnes, down 25.55 per cent Y-o-Y
- Estimated YTD May 2025 – 26,976 tonnes, down 40.79 per cent Y-o-Y
- Estimated YTD May 2024 – 45,561 tonnes
As of 2025, top buyers from Vietnam have been the US, Canada, South Korea, Japan and Poland.
As Vietnam continues to grab headlines as an emerging hub for aluminium production on the global platform, the dip in exports may indicate its push for building a resilient domestic aluminium value chain.
Additionally, as Vietnam is both a consumer and a re-exporter, a dip in its imports may have affected its export trend.
Connect with verified aluminium extrusion buyers and suppliers through the AL Biz marketplace.
When it comes to the buyers in this category, the following are the top 5 Asian importers of aluminium bars, rods and profiles:
Vietnam
In 2025, the category of aluminium bars, rods and profiles accounted for 8.89 per cent out of Vietnam’s total 1.3 million tonnes of imports of all products, including unwrought aluminium, foil, pipes and tubes, plates, sheets and strips, tubes or pipe fittings, and wire.
Vietnam’s annual import figures have remained largely stable with a marginal Y-o-Y dip.
2025 vs 2024 – 115,298 tonnes vs 115,894 tonnes, down 0.51 per cent from a year ago
As of YTD May 2026, the estimated import chart has reported a decline as well.
- Estimated YTD May 2026 – 39,226 tonnes, down 7.78 per cent Y-o-Y
- Estimated YTD May 2025 – 42,535 tonnes, down 3.98 per cent Y-o-Y
- Estimated YTD May 2024 – 44,297 tonnes
As of 2025, top exporters to Vietnam have been China, South Korea, Japan, Malaysia and Thailand.
Being heavily import-dependent on China, Vietnam’s import decline resonated with China’s export slump, thereby resulting in a drop in Vietnam’s export figures.
Malaysia
In 2025, the category of aluminium bars, rods and profiles accounted for 9.21 per cent out of Malaysia’s total 932,904 tonnes of imports of all products, including unwrought aluminium, foil, pipes and tubes, plates, sheets and strips, tubes or pipe fittings, and wire.
Malaysia has ramped up its annual imports by a considerably wide margin.
2025 vs 2024 – 85,931 tonnes vs 71,095 tonnes, up 20.87 per cent from a year ago
The estimated YTD May 2026 import figures, consistent with the annual import trend, reflect a sourcing upswing.
- Estimated YTD May 2026 – 31,692 tonnes, up 5.81 per cent Y-o-Y
- Estimated YTD May 2025 – 29,953 tonnes, up 14.78 per cent Y-o-Y
- Estimated YTD May 2024 – 26,095 tonnes
As of 2025, top exporters to Malaysia have been China, South Korea, Taiwan, Singapore and Japan.
Malaysia’s increase in imports is largely tied to domestic industrial consumption, but also because Malaysia is both a consumer and re-exporter. Hence, the rise in imports is immediately mirrored in the rise in exports.
The United Arab Emirates
In 2025, the category of aluminium bars, rods and profiles accounted for 16.04 per cent out of the UAE’s total 386,220.23 tonnes of imports of all products, including unwrought aluminium, foil, pipes and tubes, plates, sheets and strips, tubes or pipe fittings, and wire.
The UAE has reported robust annual import growth.
2025 vs 2024 – 61,941 tonnes vs 47,991 tonnes, up 29.07 per cent from a year ago
However, as of YTD May 2026, the import figures have dipped compared to the past year.
YTD May 2026 – 17,934 tonnes, down 24.66 per cent Y-o-Y
YTD May 2025 – 23,804 tonnes, up 46.4 per cent Y-o-Y
YTD May 2024 – 16,259 tonnes
As of 2025, top exporters to the UAE have been Saudi Arabia, China, Qatar, Bahrain and India.
The UAE’s rising imports and Saudi Arabia’s export growth point to stronger intra-GCC aluminium trade and regional integration. Moreover, a time of regional supply risk, logistics uncertainty, and global price swings is rendering imported semi-finished aluminium an imperative.
India
In 2025, the category of aluminium bars, rods and profiles accounted for 4.76 per cent out of India’s total 1.03 million tonnes of imports of all products, including unwrought aluminium, foil, pipes and tubes, plates, sheets and strips, tubes or pipe fittings, and wire.
India’s annual import growth rate has witnessed a Y-o-Y slump.
2025 vs 2024 – 48,986 tonnes vs 55,576 tonnes, down 11.56 per cent from a year ago
As of YTD May 2026, the estimated import figures have dipped from the previous year, too, but at a lesser rate.
- Estimated YTD May 2026 – 20,080 tonnes, down 8.76 per cent Y-o-Y
- Estimated YTD May 2025 – 22,008 tonnes, up 2.3 per cent Y-o-Y
- Estimated YTD May 2024 – 21,512 tonnes
As of 2025, top exporters to India have been China, South Korea, the UAE, Germany and Thailand.
India’s declining imports indicate the effect of import duties slowing sourcing traction, leading to a push for domestic production and import substitution policies.
Thailand
In 2025, the category of aluminium bars, rods and profiles accounted for 4.44 per cent out of Thailand’s total 1.02 million tonnes of imports of all products, including unwrought aluminium, foil, pipes and tubes, plates, sheets and strips, tubes or pipe fittings, and wire.
Thailand has reported a drastic plunge in its annual import volume.
2025 vs 2024 – 45,291 tonnes vs 68,205 tonnes, down 33.6 per cent from a year ago
Echoing the annual trend, the YTD May 2026 imports also appear to be on a declining trend.
- YTD May 2026 – 13,563 tonnes, down 27.36 per cent Y-o-Y
- YTD May 2025 – 18,672 tonnes, down 44.78 per cent Y-o-Y
- YTD May 2024 – 33,817 tonnes
As of 2025, top exporters to Thailand have been China, South Korea, Malaysia, Japan and Vietnam.
Thailand’s sharp fall in imports may be connected to the initiation of its anti-dumping probe into aluminium extrusion imports from China.
China has emerged as one of the top suppliers to these 5 importers. Hence, a dip in China’s export volume affects the import count in the intra-Asian trade chain.
AL Circle is coming up with a new Magazine "ALuminium’s Frontline: OEM Edition 2026" Feature your brand and opinion in the edition.
Upcoming projects in the Asian aluminium extrusion roadmap include the following ventures:
India: Premier Energies–Nuevosol’s Telangana extrusion or anodising plant, Insolation Green Energy’s frame manufacturing unit, Maan Aluminium’s capacity expansion, and Knest’s aluminium downstream project.
Vietnam: Kam Kiu Aluminium Products Group’s Nam Dinh aluminium plant.
Saudi Arabia: ALUPCO–Asia Aluminum Group’s Riyadh aluminium industrial hub project.
Malaysia: Ongoing extrusion capacity additions led by LB Aluminium Berhad and related exporters.
Nepal: Litmus Industries’ first dedicated aluminium rod plant.
South Korea: HAI–LS Cable & System’s Gumi extrusion plant and AR Aluminum’s 9,000-ton press expansion in Sacheon.
These initiatives underscore the position of Asia as a key supplier hub in the aluminium extrusion market.

Hulamin returns to growth with R395.4m as rolling operations regain momentum
Next articleOswego restart, Bay Minette aluminium project fuel Novelis’ 71% Q1 FY27 profit
Grow with
AL Circle