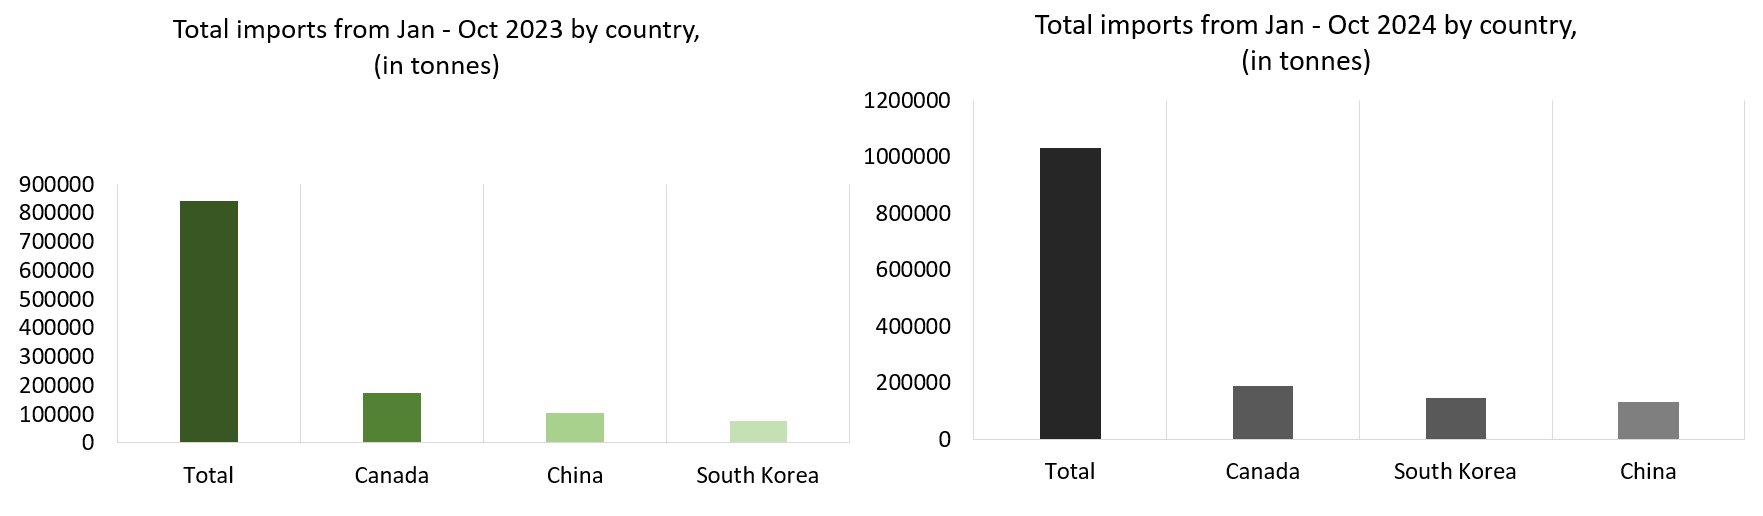
Until October 2024, the United States imported 1.03 million tonnes of aluminium plates, sheets and bars versus 842,000 tonnes a year ago. That reflected an annual hike of 22.37 per cent, driven by back-to-back significant import volumes from April to July 2024, ranging between 106,000 and 120,000 tonnes. From August onwards, imports decreased below 100,000 tonnes, averaging around 93,000 to 96,000 tonnes.
According to the United States Geological Survey, imports of aluminium plates, sheets, and bars increased month-on-month, though they remained below the levels observed in the second quarter of 2024. In October 2024, the United States aluminium plates, sheets and bars imports stood at 96,200 tonnes versus 94,100 tonnes in September and 77,600 tonnes in October 2023, marking M-o-M increase of 2.23 per cent and year-on-year hike of 23.96 per cent.
From January to December 2023, the United States imported 1.08 million tonnes of aluminium plates, sheets and bars. To match this volume, the US would need to import 50,000 tonnes combined in November and December 2024.
Top 3 sources of imports in ten months
The United States imported 187,000 tonnes of aluminium plates, sheets and bars from Canada through the first ten months of 2024, marking a 6.86 per cent rise from 175,000 tonnes a year earlier. In October 2024, the import from Canada was 19,300 tonnes, up by 9.66 per cent from 17,600 tonnes in September and 24.52 per cent higher than 15,500 tonnes in October 2023.
Canada’s aluminium plates, sheets and bars exports to Canada grew until October 2024 despite witnessing a few monthly declines in intermittent periods, such as in February, May, June, and August. In these four months, the export volume decreased by 22.54 per cent, 8.13 per cent, 7.29 per cent, and 8.94 per cent, respectively, from their previous months.
After Canada, South Korea is the second-highest exporter of aluminium plates, sheets and bars to the US. In October, the United States imported 15,100 tonnes of aluminium semis, compared to 15,500 tonnes in September and 9,830 tonnes in October 2023. The data suggests the import volume dipped month-on-month but rose 53.61 per cent year-on-year.
From January to October, the Republic of Korea exported 147,000 tonnes of semis, up by 94.19 per cent from 75,800 tonnes during the corresponding period of the previous year.
The third-largest supplier, China, exported 132,000 tonnes of aluminium plates, sheets and bars to the United States during January-October 2024. That was 26.92 per cent higher Y-o-Y than 104,000 tonnes, according to the USGS data.
Whilst the United States aluminium semis imports from these top suppliers are increasing year-on-year, some countries are experiencing declines in exports over time. For instance, Oman, South Africa, Thailand, and Turkey, whose exports were 56,500 tonnes, 34,000 tonnes, 29,300 tonnes, and 31,100 tonnes during January-October 2023, and in contrast this year, stood at 49,200 tonnes (-12.92 per cent), 11,600 tonnes (-65.88 per cent), 26,200 tonnes (-10.58 per cent), and 24,200 tonnes (-22.19 per cent), respectively.