EU downstream aluminium exports rise 6.8%, while imports fall 8.7% in 2026: Key trade trends at a glance
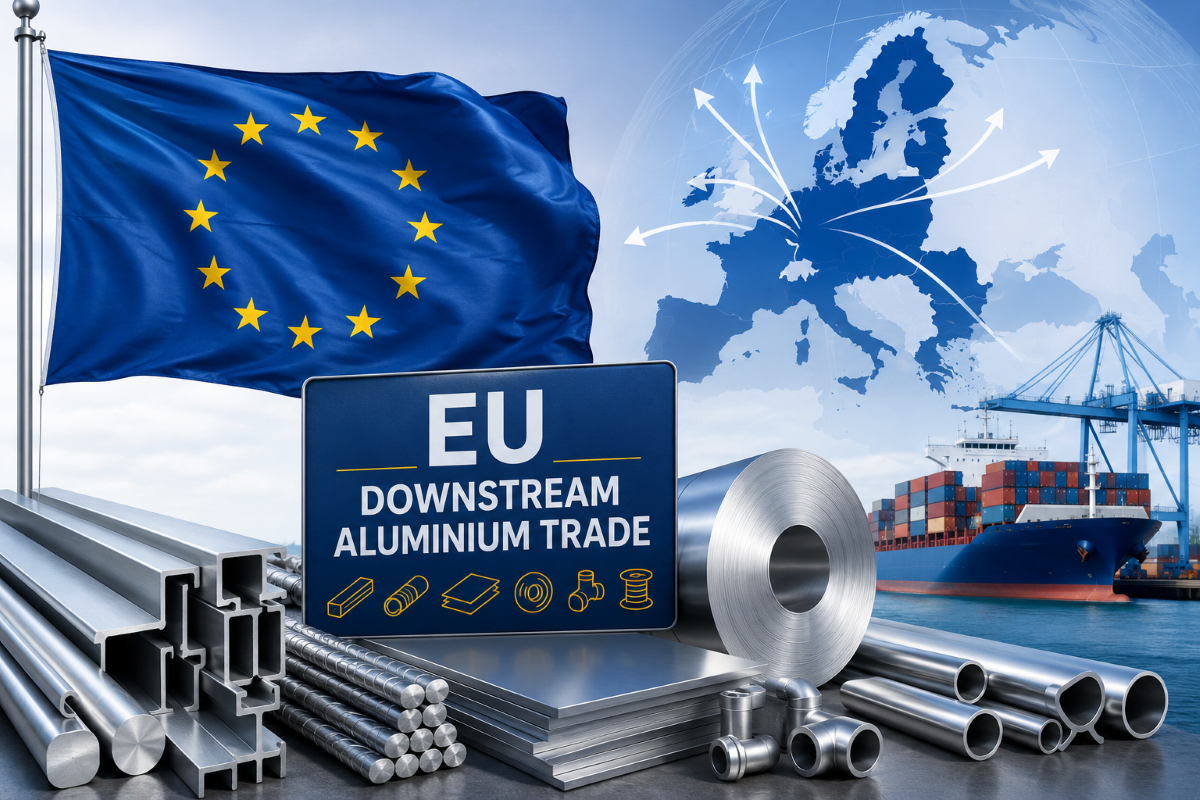
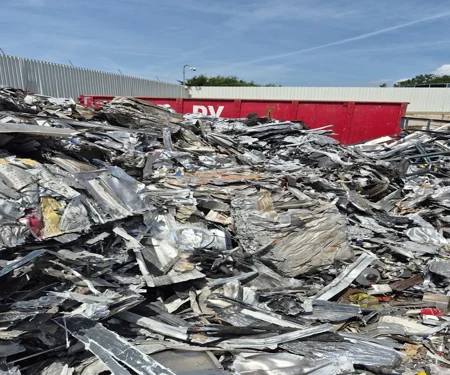
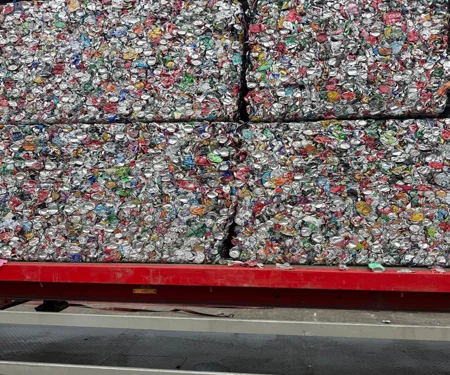
The image used in this article is generated with an AI tool and does not depict any real-time moment
The European Union's downstream aluminium trade reveals an interesting divergence. Why are exports continuing to strengthen while imports lose momentum? The latest trade data offers insights into shifting demand patterns, evolving trade flows, and the EU's growing role in global downstream aluminium markets.
January-April 2026 import graph
The EU's cumulative imports of downstream aluminium products during the first four months of the past three years are as follows:
- YTD 2026: 635,440.94 tonnes, valued at USD 3.26 billion (volume down 8.7 per cent; value up 1.2 per cent)
- YTD 2025: 695,728.55 tonnes, valued at USD 3.22 billion (volume up 9.9 per cent; value up 19.3 per cent)
- YTD 2024: 633,106.85 tonnes, valued at USD 2.7 billion
January-April 2026 export graph
The EU's downstream aluminium exports maintained an upward trajectory during the same period.
- YTD 2026: 609,229.36 tonnes, valued at USD 3.8 billion (volume up 6.8 per cent; value up 15.2 per cent)
- YTD 2025: 570,270.92 tonnes, valued at USD 3.3 billion (volume up 4.5 per cent; value up 13.8 per cent)
- YTD 2024: 545,519.25 tonnes, valued at USD 2.9 billion
Looking to source or sell aluminium extrusions? Discover relevant business opportunities on our B2B marketplace.
Annual export graph: Total vs downstream
Downstream aluminium products continued to account for the bulk of the EU's aluminium exports.
In 2025, total aluminium exports increased to 2 million tonnes, with downstream aluminium products accounting for 1.68 million tonnes, or 84.0 per cent of the total.
In 2024, the EU exported a total of 1.9 million tonnes of aluminium products, of which 1.62 million tonnes, or 85.3 per cent, were downstream aluminium products.
YTD export graph: Total vs downstream
From January to April 2026, the EU-27 exported 782,331.99 tonnes of aluminium products, of which 609,229.3 tonnes, representing 77.9 per cent, were downstream aluminium products.
Unlock key insights from leading companies and experts across the aluminium ecosystem with our e-Magazine - Mine to Market: ALuminium Producers & Manufacturers 2026
Top 5 export destinations of EU
According to data compiled by the International Trade Administration (ITA), the top five destinations for EU-27 downstream aluminium exports in 2025 were:
- United Kingdom - 513,890.96 tonnes
- United States - 256,720.65 tonnes
- Switzerland - 245,483.26 tonnes
- Türkiye - 106,754.06 tonnes
- Serbia - 72,357.34 tonnes
Top export destinations (January-April 2026)
- United Kingdom - 159,459.29 tonnes
- United States - 143,454.83 tonnes
- Switzerland - 87,964.08 tonnes
- Türkiye - 36,988.48 tonnes
- Serbia - 22,706.41 tonnes
_(1)_0_0.png)
ElvalHalcor launches new shares, backs €855m aluminium rolling mill expansion by 2030
Next articleKaiser Aluminum’s record Q2’26: Net sales top $1.3b, EBITDA gains 102.4%
Grow with
AL Circle