China accounts for 70.8% of Australian bauxite exports in January–October 2026
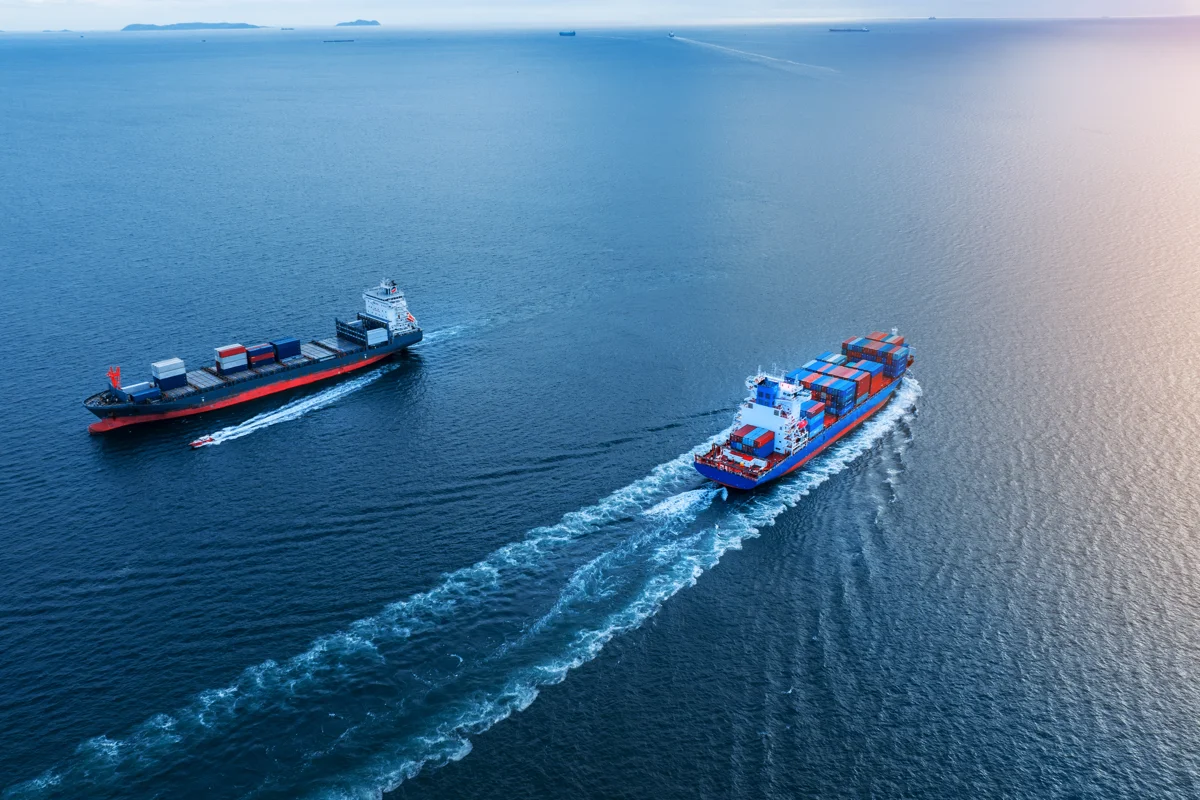
Stock image for referential purposes only
Australia exported 51.44 million tonnes of bauxite during January–October 2026, with China accounting for 70.8 per cent of total shipments, according to Signal Ocean's tracked flows. Total exports were 4.8 per cent lower than the 54.05 million tonnes recorded in the corresponding period of 2025, while China-bound shipments increased 2.7 per cent to 36.41 million tonnes.
Shipments to destinations outside China totalled 15.03 million tonnes, down 19.1 per cent year on year. China's share of Australian bauxite exports consequently increased from 65.6 per cent in January–October 2025 to 70.8 per cent in the same period of 2026.
Australian export trends
Quarterly shipments gathered pace in Q3, rising 6.4 per cent from Q2 to 17.08 million tonnes, although volumes remained 5.1 per cent below the corresponding quarter of 2025. October exports stood at 5.79 million tonnes, 3.2 per cent lower month on month and 1.3 per cent higher year on year.
China-bound shipments in October increased 13.6 per cent year on year to 4.37 million tonnes, while exports to other destinations were 23.9 per cent lower. In the week ending November 8, total Australian bauxite exports were 0.88 million tonnes. China received 0.75 million tonnes, while other destinations accounted for 0.13 million tonnes.
Explore the production, demand and consumption forecasts of bauxite and alumina in our report: "Global Bauxite & Alumina Market Forecast to 2036: Supply–Demand, Trade Flows & Price Outlook"
Australian supply and Chinese demand
Metro Mining reported October shipments of 752,000 wet tonnes from its Bauxite Hills operation, approximately 14 per cent higher than September. The company also recorded a loading time of 5.8 days for a Capesize vessel, its fastest turnaround of 2026.
In China, aluminium ingot inventories across three major regions stood at 370,000 tonnes on November 11, down 6,000 tonnes. Weekly alumina production was 1.73 million tonnes as of November 5, with the operating rate at 75.55 per cent.
The greater concentration of shipments on the Australia–China route favours shorter Pacific voyages over longer Guinea–China journeys, affecting Capesize tonne-mile demand.
Forward vessel availability
The 40-day forward vessel balance for C3 Brazil–China moved from a shortfall of nine ships to 48 ships. C5 West Australia–China remained in surplus, with 37 vessels available.
Panamax availability also changed across several routes. The P1/P2/P7 Atlantic balance moved from a 34-vessel shortfall to an even position, while P6 Singapore–Atlantic shifted to a surplus of 10 vessels. The P3 Pacific shortfall narrowed from 29 to 10 ships, while P5 Indonesia–China remained 45 ships short.
Find the right unwrought aluminium for your business. Browse a comprehensive list of primary aluminium products on AL Biz.
Dry-bulk freight rates
The Baltic Dry Index (BDI) rose 91 points to 2,805 on November 6, supported by an increase in the Capesize index, which gained 218 points to 4,344. Capesize 5TC average earnings increased by USD 1,975 per day to USD 39,395 per day.
On the key West Australia–China route (C5), Capesize freight business was concluded at USD 13.25 per tonne on November 6, compared with USD 13.80 per tonne on November 9. Brazil–China (C3) rates moved towards USD 37 per tonne, to USD 36.52 per tonne on November 9.
Unlock key insights from leading companies and experts across the aluminium ecosystem with our e-Magazine - Mine to Market: Aluminium Producers & Manufacturers 2026
Vessel availability across dry-bulk segments
Capesize global ballaster numbers declined from 623 in Week 44 to 607 in Week 45. South Atlantic numbers increased from 69 to 79, while Indian Ocean/South Atlantic numbers moved from 160 to 143 and Australasia from 230 to 223.
Panamax global ballasters moved from 811 to 796. Australasia increased from 219 to 227, while South Atlantic numbers changed from 65 to 57.
Supramax global ballasters increased from 716 to 723, with Australasia rising from 160 to 202. Far East Asia/North Pacific numbers moved from 202 to 180.
Handysize global ballasters increased from 668 to 677. North Atlantic numbers rose from 186 to 203, while Australasia moved from 145 to 135.
Grow with
AL Circle










_md.webp)
_md.webp)
_md.webp)