Bauxite volume vs price in 2026: What changed in the global trade curve in Jan-May 2026?
The images used in this article is generated with an AI tool and does not depict any real-time moment
The global bauxite trade entered 2026 with a clear divergence between volume and cost. More ore moved into the world's largest consuming market, Guinea expanded its shipments, Australia maintained growth, and several smaller origins recorded sharp changes in their trade volumes. At the same time, the average import cost of bauxite entering China fell substantially.
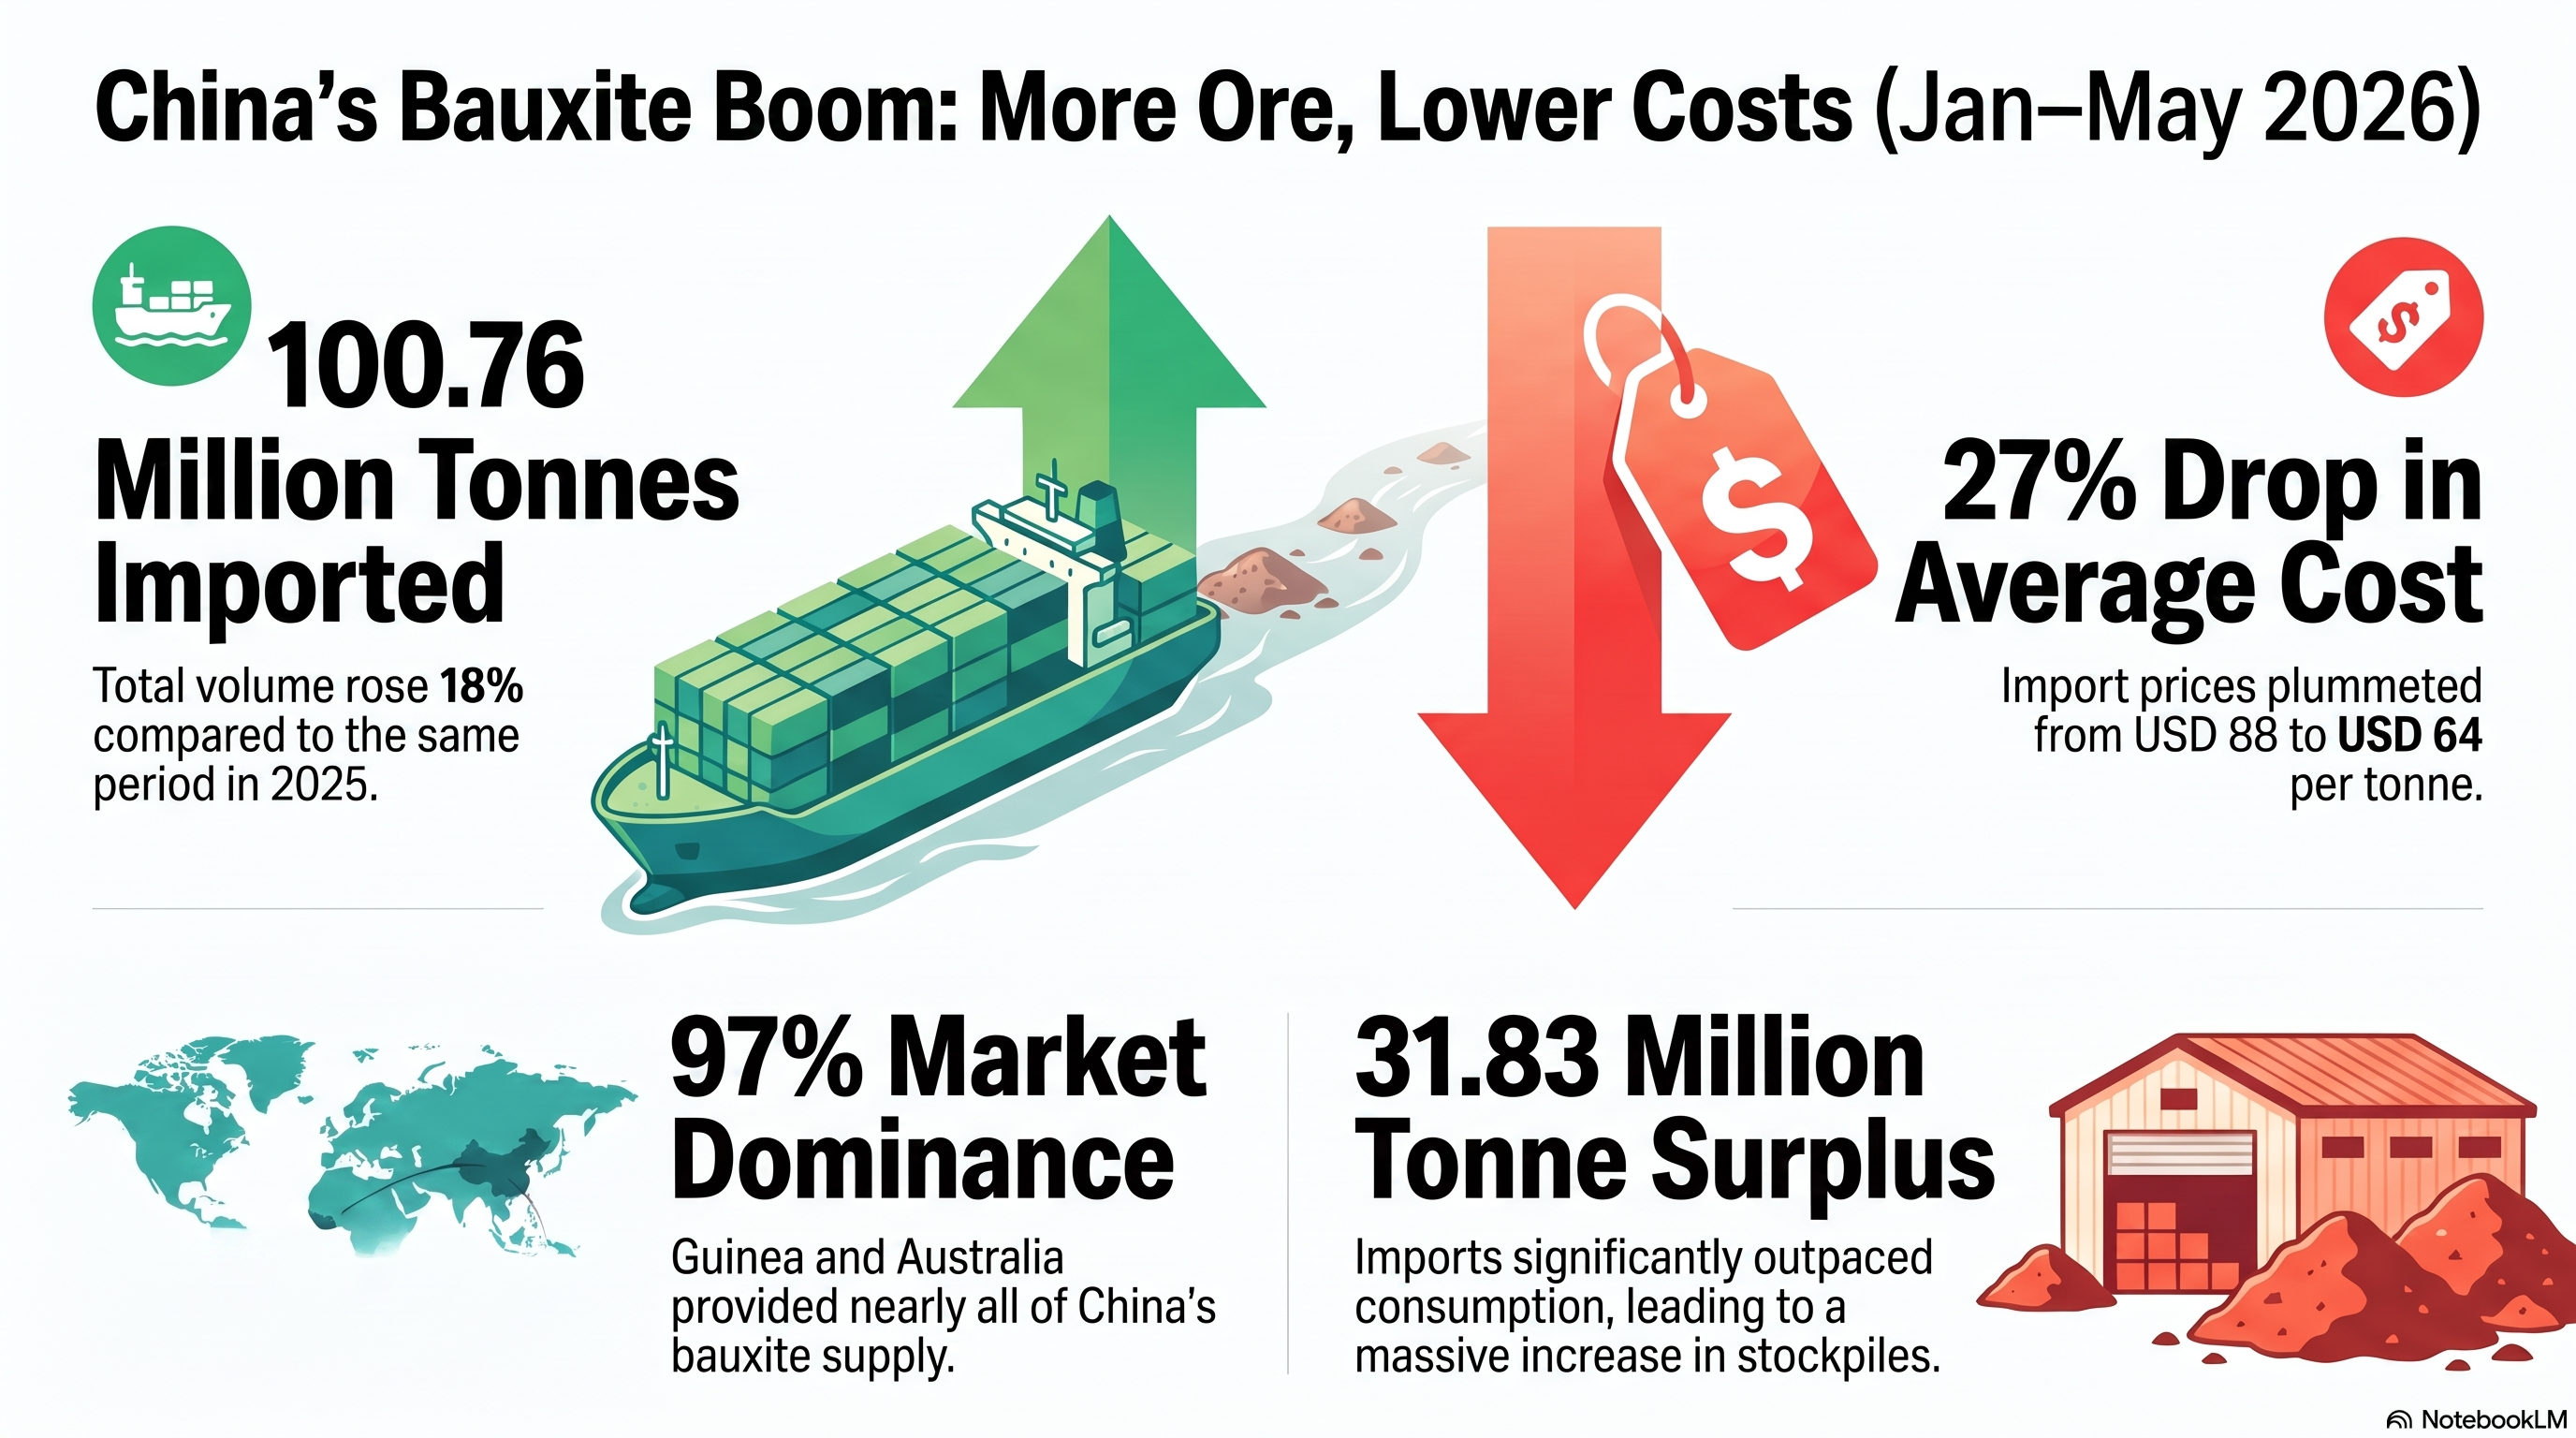
China imported 100.76 million tonnes of bauxite during January-May 2026, compared with 85.29 million tonnes in the corresponding period of 2025. The increase amounted to 15.47 million tonnes, or 18 per cent year-on-year. Yet, the average import cost declined from USD 88 per tonne to USD 64 per tonne, a fall of 27 per cent.
The May figures extended this trend. China imported 23.03 million tonnes during the month, against 19.4 million tonnes in April. Guinea supplied 19.61 million tonnes in May, up from 16.42 million tonnes in April. The average cost of China's total May bauxite imports stood at USD 64 per tonne.
The broader seaborne market also recorded higher flows. Signal Ocean data shows global bauxite flows increasing 24 per cent year-on-year in April 2026, while flows to China rose 26 per cent. India recorded a 24 per cent increase in April arrivals, whereas flows to the UAE remained 72 per cent below their year-earlier level.
The January-May curve: 15.47 million more tonnes, USD 24 less per tonne
China's imports were heavily concentrated in two origins. Guinea supplied 82.57 million tonnes during January-May 2026, while Australia supplied 14.49 million tonnes. Together, the two countries accounted for 97.32 per cent of China's total bauxite imports during the period.
Guinea alone represented 81.95 per cent of the total, while Australia's contribution was 14.38 per cent. All remaining origins collectively supplied approximately 3.69 million tonnes, or 3.67 per cent.
The supply concentration was even higher in May. Guinea shipped 19.61 million tonnes to China, while Australia supplied 3.03 million tonnes. Their respective shares of China's 23.03 million tonnes of May imports were 85.14 per cent and 13.14 per cent. Together, they accounted for 98.28 per cent of the month's total.
To know the long-term bauxite market forecast, book our report: “Global Bauxite & Alumina Market Forecast to 2036: Supply–Demand, Trade Flows & Price Outlook”
Guinea adds 16.23 million tonnes to China's five-month supply
Guinea was the largest contributor to China's additional import volume.
China's imports from Guinea increased from 66.34 million tonnes in January-May 2025 to 82.57 million tonnes in the same period of 2026. The absolute increase was 16.23 million tonnes, while the year-on-year growth rate was 24 per cent.
The increase from Guinea was larger than China's overall import growth of 15.47 million tonnes because volumes from several other origins declined during the same period.
The cost movement was equally significant. The average cost of Guinean bauxite imported into China fell from USD 90 per tonne in January-May 2025 to USD 66 per tonne in 2026, a decline of 27 per cent. In May alone, China received 19.61 million tonnes from Guinea at an average cost of USD 65 per tonne.
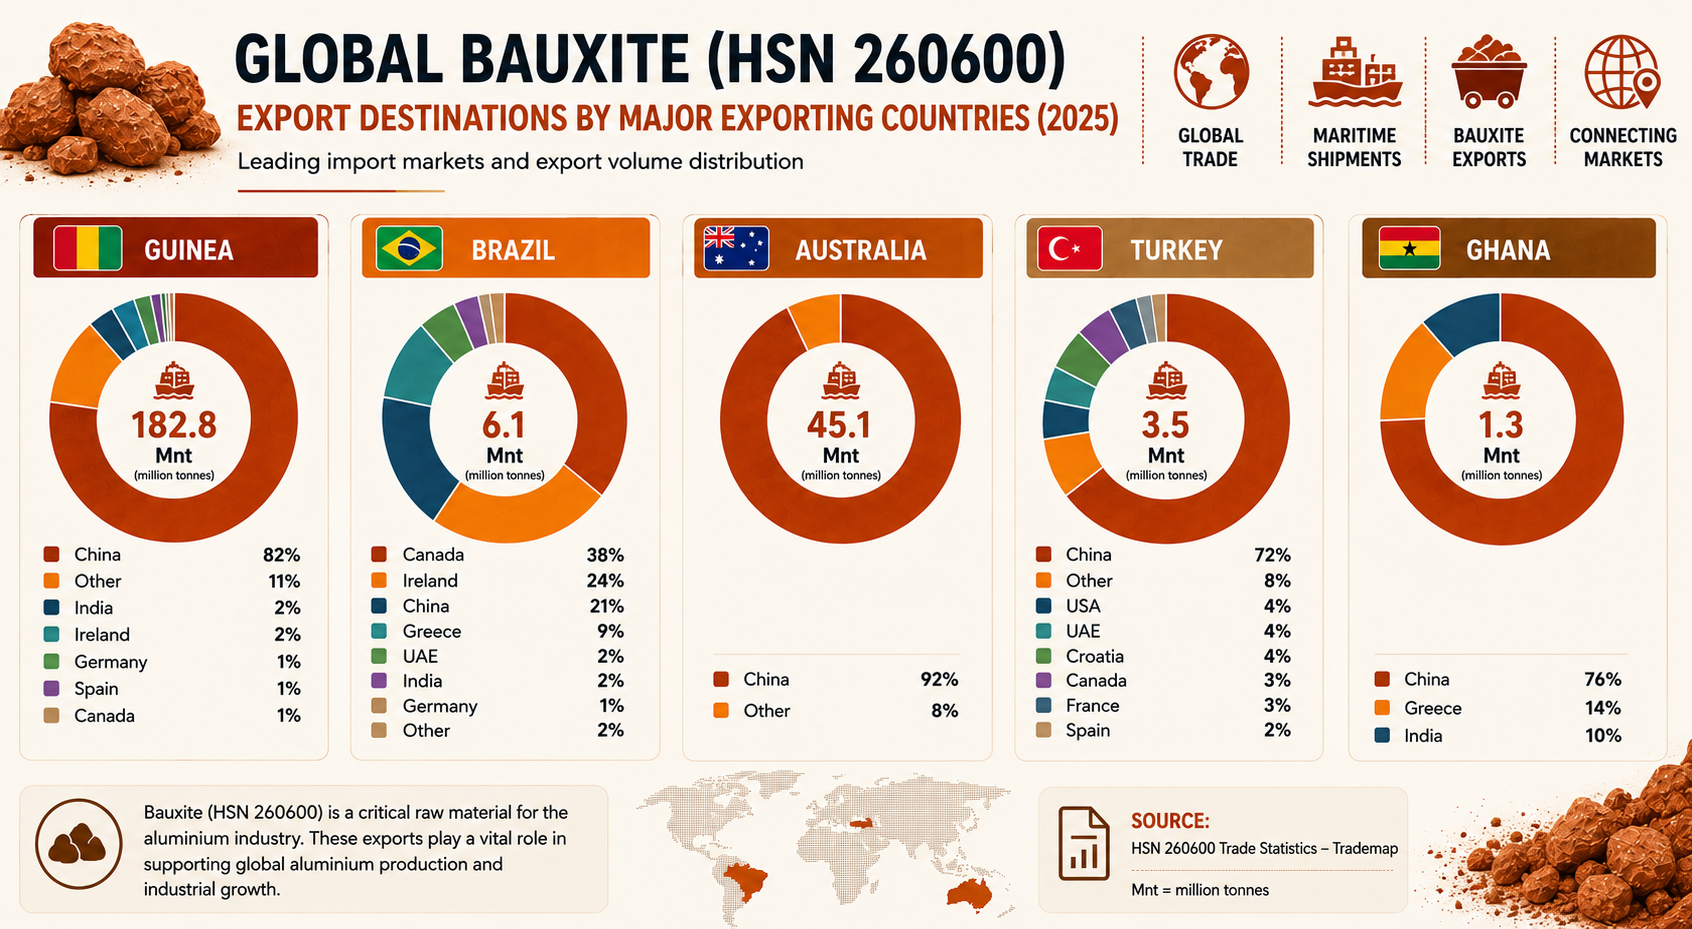
Guinea's overall export base had already expanded sharply in 2025. The country exported 182.8 million tonnes during the year, making it by far the largest exporter among the five countries represented in the supplied TradeMap dataset.
The five exporters—Guinea, Australia, Brazil, Turkey and Ghana—shipped a combined 238.8 million tonnes in 2025. Guinea accounted for 76.55 per cent of that total, followed by Australia at 18.89 per cent, Brazil at 2.55 per cent, Turkey at 1.47 per cent and Ghana at 0.54 per cent.
The destination data also shows that the export routes of four of these five suppliers were heavily oriented towards China.
China dominates Guinea and Australia's export destinations
Of Guinea's 182.8 million tonnes of exports in 2025, 82 per cent went to China. Based on the total volume and destination share shown in the supplied infographic, this is equivalent to approximately 149.90 million tonnes.
The remaining destinations had considerably smaller shares. India and Ireland each accounted for 2 per cent, equivalent to approximately 3.66 million tonnes each. Germany, Spain and Canada each received 1 per cent, or around 1.83 million tonnes apiece. The remaining 11 per cent, approximately 20.11 million tonnes, went to other destinations.
Australia's export structure was even more concentrated. Of its total 45.1 million tonnes of exports, 92 per cent, or approximately 41.49 million tonnes, went to China. Other markets collectively accounted for the remaining 8 per cent, equivalent to around 3.61 million tonnes.
Together, Guinea and Australia exported 227.9 million tonnes in 2025, representing 95.44 per cent of the combined 238.8 million tonnes shipped by the five countries in the infographic. Based on the destination percentages shown, approximately 191.39 million tonnes of their combined exports were directed to China.
The destination pattern was therefore highly concentrated for the two largest exporters in the supplied dataset. Guinea's China-bound volume was approximately 3.61 times Australia's China-bound exports.
Brazil maintains the most diversified destination portfolio
Brazil's export pattern differed from those of Guinea and Australia. Its 6.1 million tonnes of exports were distributed across several markets.
Canada was the largest destination, receiving 38 per cent, equivalent to approximately 2.32 million tonnes. Ireland followed with 24 per cent, or around 1.46 million tonnes, while China accounted for 21 per cent, approximately 1.28 million tonnes.
Greece received 9 per cent, or approximately 549,000 tonnes. The UAE and India each accounted for 2 per cent, equivalent to approximately 122,000 tonnes each, while Germany received 1 per cent, or around 61,000 tonnes. Other destinations accounted for another 2 per cent, also equivalent to approximately 122,000 tonnes.
Thus, while China was the leading destination for Guinea, Australia, Turkey and Ghana, it ranked third among Brazil's export markets in 2025.
Brazil's three largest destinations, Canada, Ireland and China, together received approximately 5.06 million tonnes, accounting for 83 per cent of the country's exports represented in the infographic.
Explore the relevance of red mud in the sustainable aluminium industry in A Comprehensive Analysis of Bauxite Residue (Red Mud): Sustainability, Resource Recovery and Strategic Recommendations
China also leads Turkey and Ghana's destination mix
Turkey exported 3.5 million tonnes of bauxite in 2025. China received 72 per cent, equivalent to approximately 2.52 million tonnes.
The remaining exports were distributed among several destinations. The US, the UAE and Croatia each accounted for 4 per cent, equivalent to approximately 140,000 tonnes per market. Canada and France each received 3 per cent, or around 105,000 tonnes each, while Spain accounted for 2 per cent, approximately 70,000 tonnes. The infographic groups another 8 per cent, or approximately 280,000 tonnes, under other destinations.
Ghana's 1.3 million tonnes of exports were divided among only three destinations in the supplied dataset. China accounted for 76 per cent, equivalent to approximately 988,000 tonnes. Greece received 14 per cent, or approximately 182,000 tonnes, while India accounted for the remaining 10 per cent, equivalent to around 130,000 tonnes.
Across the five exporters shown in the infographic, the destination data establishes a China-facing trade pattern for Guinea, Australia, Turkey and Ghana, alongside a more distributed market structure for Brazil.
Australia grows by 8 per cent, while smaller origins move in different directions
Australia remained China's second-largest supplier during January-May 2026. Shipments increased from 13.46 million tonnes to 14.49 million tonnes, an addition of 1.03 million tonnes, or 8 per cent.
Its average cost declined from USD 80 per tonne to USD 58 per tonne, a fall of 28 per cent. In May, Australian bauxite arrivals reached 3.03 million tonnes at an average cost of USD 56 per tonne.
The smaller origins recorded mixed volume trends.
Sierra Leone posted the largest percentage increase, with shipments rising from 204,030 tonnes to 1.04 million tonnes, an increase of 407 per cent. Côte d'Ivoire's supply increased 69 per cent, from 256,269 tonnes to 434,037 tonnes. Guyana recorded a 4 per cent increase to 747,162 tonnes, while Brazil rose 8 per cent to 256,211 tonnes.
In contrast, Turkey's shipments fell 65 per cent, from 1.58 million tonnes to 559,145 tonnes. Malaysia recorded a 77 per cent decline, Laos 43 per cent, India 6 per cent, and the residual “other” category 55 per cent.
The cost direction was predominantly downward. Turkey's average cost fell 29 per cent to USD 54 per tonne; Malaysia's fell 27 per cent to USD 55; Côte d'Ivoire's declined 22 per cent to USD 68; Guyana's fell 22 per cent to USD 76; Sierra Leone's declined 18 per cent to USD 68; and India-origin material recorded the steepest decline at 37 per cent, to USD 55 per tonne.
Brazil was the exception in the dataset. Its average cost increased 2 per cent, from USD 115 per tonne to USD 118 per tonne, while its volume supplied to China increased 8 per cent.
Stock accumulation rises as imports exceed reported consumption
China's five-month import volume also exceeded the reported use of imported bauxite.
Against total imports of 100.76 million tonnes, reported consumption of imported bauxite stood at 68.93 million tonnes during January-May 2026. The difference was 31.83 million tonnes. The accompanying dataset describes this difference as an increase in imported bauxite stockpiles during the period.
A separate sourcing dataset in industry research documents records the direction of change in China's raw-material use in May 2026 compared with May 2025. Domestic bauxite consumption by alumina producers declined 22.40 per cent, domestic purchases fell 22.77 per cent, and domestic stockpiles decreased 18.37 per cent.
Over the same comparison period, imported bauxite consumption increased 31.53 per cent, imported purchases rose 51.13 per cent, and imported bauxite stockpiles increased 21.03 per cent.
Australia supplied 1.23 million tonnes in the source-country YTD dataset, while Indonesia's volume increased to 183,701 tonnes and India's to 59,456 tonnes. The same table records substantial year-on-year percentage increases in volumes from Australia, Indonesia and India, alongside lower average costs.
Taken together, the January-May figures show that the 2026 bauxite trade expansion has been led overwhelmingly by Guinea, with Australia retaining its position as the second-largest supplier to China and smaller origins recording widely divergent volume movements. But the rise in traded tonnage has been accompanied by an equally significant shift in costs.
Note: This is Part 1 of AL Circle’s two-part series on the changing global bauxite trade landscape. Part 2 examines the other side of the 2026 trade story: why bauxite costs have declined despite rising volumes, and how stock accumulation, Guinea’s expanding export infrastructure, shifting trade routes and proposed export controls are shaping the market outlook. Also, this is exclusive coverage by AL Circle and may not be reproduced, republished or shared without prior permission.
Alcoa targets a larger aluminium, alumina and bauxite portfolio with the South32 acquisition
Next articleMetro Mining’s June bauxite shipments jump 29% as Q2 volumes hit record 1.8 million WMT
Grow with
AL Circle