Australia’s 2026 aluminium exports hit 566kt as unwrought holds 99.8% dominance
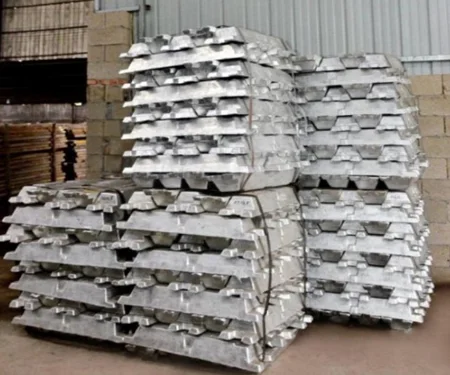
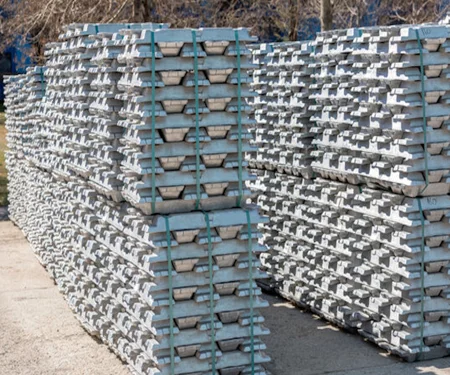
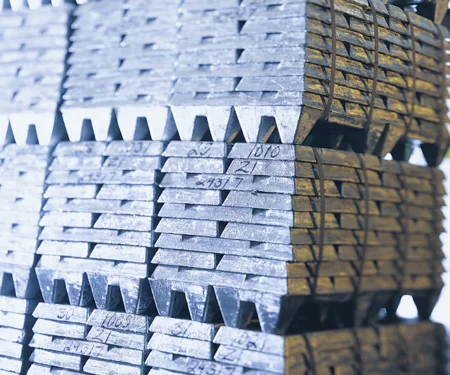
Stock image for referential purposes only
If we take a look at Australia’s global aluminium export trend, which product category of aluminium dominates the shipment volume? Here is a comparison between the volumes of unwrought aluminium and the other downstream segments supplied by Australia to the world.
January-May 2026 export graph: Total vs unwrought
As of year-to-date (YTD) January to May 2026, Australia’s cumulative export of all the aluminium product categories, viz., unwrought, bars, rods and profiles, foil, pipes and tubes, plates, sheets and strip, tube or pipe fittings, and wire, the year-on-year trend goes like this:
YTD 2026 – 566,386.47 tonnes, up 1.98 per cent Y-o-Y from 555,407.67 tonnes in YTD 2025
YTD 2025 – 555,407.67 tonnes, down 6.48 per cent Y-o-Y from 593,920.51 tonnes in YTD 2024
Explore the relevance of red mud in the sustainable aluminium industry in A Comprehensive Analysis of Bauxite Residue (Red Mud): Sustainability, Resource Recovery and Strategic Recommendations
Interestingly, the unwrought aluminium shipment volume remains very close to the cumulative:
YTD 2026 – 565,180.39 tonnes, up 2.41 per cent Y-o-Y from 551,897.11 tonnes in YTD 2025
YTD 2025 – 551,897.11 tonnes, down 6.78 per cent Y-o-Y from 592,013.66 tonnes in YTD 2024
So, as of YTD 2026, the share of unwrought aluminium accounted for 99.79 per cent of the lion’s share of Australia’s total aluminium shipment volume.
The historical data also indicates how the unwrought metal dominated 99.37 per cent of the total export in YTD 2025 and 99.68 per cent in YTD 2024.
Annual export graph: Total vs unwrought
Annually, in 2025 Australia’s cumulative export of all the aluminium product categories amounted to 1.45 million tonnes, reporting a Y-o-Y decline of 1.89 per cent from the 1.47 million tonnes exported in 2024.
Once again, out of this, unwrought aluminium accounted for 99.4 per cent of the total shipment, reaching 1.44 million tonnes, down 2.04 per cent Y-o-Y from the 1.47 million tonnes recorded in 2024.
Unlock key insights from leading companies and experts across the aluminium ecosystem with our e-Magazine - Mine to Market: ALuminium Producers & Manufacturers 2026
Top destinations at a glance
As per the data accumulated by the International Trade Administration (ITA), as of 2025, the top five destinations for Australia’s aluminium exports are as follows:
South Korea – 348,451.55 tonnes, valued at USD 944.2 million
Japan – 341,736.66 tonnes, valued at USD 902.99 million
Vietnam – 167,433.36 tonnes, valued at USD 397.63 million
Taiwan – 140,658.49 tonnes, valued at USD 364.23 million
Malaysia – 133,502.47 tonnes, valued at USD 364.18 million
Middle East situation volatile and uncertain, aluminium prices consolidate and adjust
Next articleOceania's H1 2026 primary aluminium production rises 2.2% Y-o-Y to 943,000t as Q2 recovery offsets weather-hit Q1
Grow with
AL Circle