The United States is one of the leading aluminium scrap exporters in the world, with an annual average export volume close to 2 million tonnes. In 2023, the country exported 2.06 million tonnes, and by October, 1.74 million tonnes was shipped. In the first ten months of the subsequent year, the export volume totalled 1.73 million tonnes, reflecting a Y-o-Y dip of 0.6 per cent, according to the US Census Bureau Statistics. Was this decline consistent throughout the first ten months? What factors contributed to the fall? And which country had the most significant impact on the drop? All these will be closely studied in this comprehensive article.
Month-on-month export volume trend
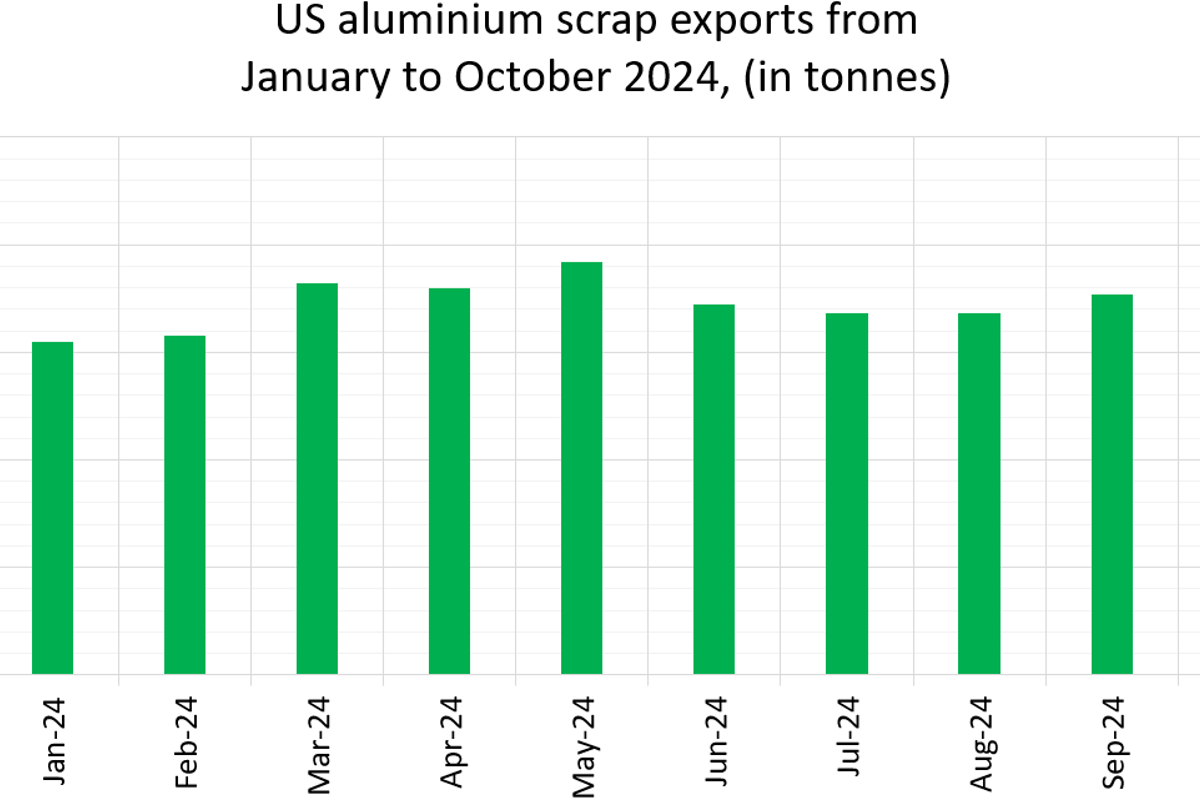
To address the first question, let us delve into the month-wise export volume by the United States. In the first three months of 2024, the United States aluminium scrap exports grew each month, starting from 155,000 tonnes in January after a M-o-M increase of 1.97 per cent to 158,000 tonnes in February, up by 1.94 per cent from January, the export volume at the end of March summed up 182,000 tonnes - 15.2 per cent higher than in February.
In April, the export volume inched down to 180,000 tonnes but recovered within a month, reaching 192,000 tonnes at the end of May. However, in June and July, the United States witnessed back-to-back declines, standing at 172,000 tonnes, sharply down by 20,000 tonnes from the previous month, and further lower at 168,000 tonnes in July.
August saw a restraint, while September encountered an improvement of 5.36 per cent to 177,000 tonnes, which again fell by 1.7 per cent in the succeeding month to 174,000 tonnes.
The above data suggests a constant fluctuation in the United States aluminium scrap export volume through the first ten months of 2024, with the most intense M-o-M fall in June.
The ongoing problems in the Baltic Sea region, a vital trade route for India, could be attributed to the decline in aluminium scrap exports. In addition, the increased consumption of scrap in the domestic market for the production of goods with high recycled aluminium content could be another possible reason for the decline in export volume, as evident from the aluminium scrap recovery rate. According to USGS data, the United States recovered 2.936 million tonnes of aluminium scrap during January-October 2024 versus 2.766 million tonnes during the corresponding period of the previous year. That marked a year-on-year increase of 6.15 per cent in the US aluminium scrap recovery.
Contributors to the export fall
India, the largest importer of aluminium scrap from the United States, witnessed a sharp fall in its total aluminium scrap imports from January to October 2024. From 397,000 tonnes, the import volume decreased by 12.85 per cent to 346,000 tonnes during the period under review. Here’s the problem in the Baltic Sea region played a major role as it is a vital trade route between India and the United States. Houthi rebels have been carrying out missile and drone attacks on cargo ships in the Red Sea, leading to supply-chain disruptions and delays in shipments. India’s trade flows through the Red Sea, so the crisis has taken a toll on India’s imports from the United States.
Except in March, May, July, and September, the United States aluminium scrap exports to India fell M-o-M, standing as low as 25,900 tonnes in January, 20,900 tonnes in February, and 26,500 tonnes in October.
A fall in supply to the Republic of Korea also affected the United States year-to-date aluminium scrap exports. From January to October 2023, the United States shipped 234,000 tonnes to South Korea, which decreased by 15.81 per cent Y-o-Y to 197,000 tonnes. The most significant decline occurred in January 2024, with exports plunging from a staggering volume of 20,600 tonnes to meagre 1,610 tonnes. Although exports to South Korea increased in the following months, the growth was not enough to offset the sharp drop in January.