A should-cost analysis of an aluminium tower furnace in India: Comparing the economics of LPG, PNG, and electric energy sources
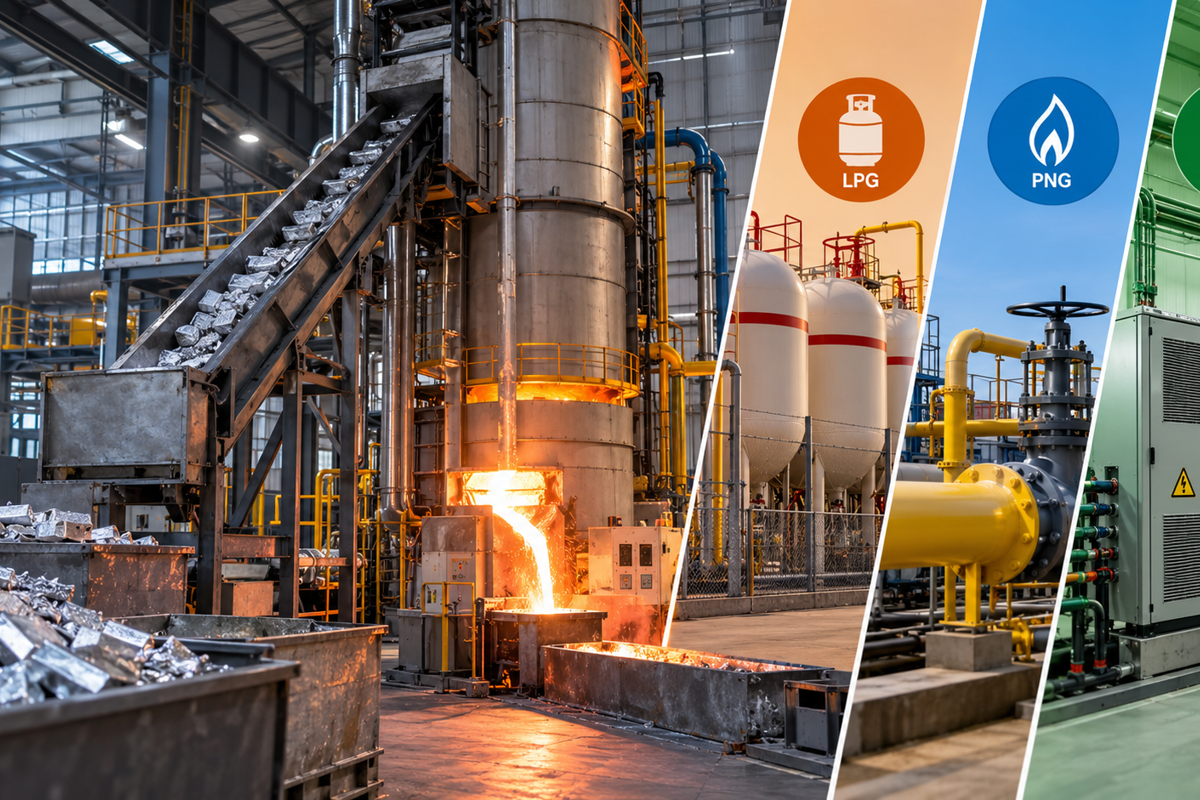
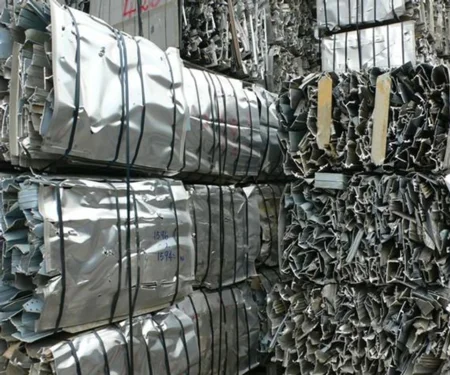
The image used in this article is generated with an AI tool and does not depict any real-time moment
In precision non-ferrous casting and high-volume die-casting operations, thermal energy conversion represents one of the largest controllable operating expenses. In modern aluminium foundries, where margins are squeezed by primary metal price fluctuations and stringent customer cost breakdowns, even a modest INR 1–2/kg variance in liquid metal melting cost can translate into tens of lakhs of rupees in annual cost differences.
A rigorous, transparent should-cost benchmark is therefore essential for procurement teams, foundry managers and strategic sourcing leaders.
This analysis examines a baseline should-cost model for a 1,000 kg/hour aluminium shaft or tower furnace in an industrial foundry. It compares liquefied petroleum gas (LPG), piped natural gas (PNG) and electric energy across capital investment, depreciation, direct energy use, operating expenses, overheads and metal oxidation losses.
Baseline parameters and operational envelope
To establish an equitable benchmark across energy sources, the model standardises the facility’s operating parameters and furnace throughput. The evaluated system is a vertical shaft tower furnace with a nominal melting capacity of 1,000 kg/hour.
The model assumes 300 operating days per year and a 20-hour daily duty cycle, giving 6,000 operating hours annually. Total annual melted output is modelled at 3,000 tonnes, equivalent to an effective throughput of 500 kg/hour and 50% utilisation of the furnace’s nominal hourly capacity.
The economic framework assumes a 15-year asset life, a capital discount rate or weighted average cost of capital of 10% per annum, factory and administrative overheads of 12% applied to subtotal conversion costs, and a P1020 primary aluminium reference price of INR 354.95/kg.
Capital expenditure, depreciation and financing costs
Capital equipment costs vary by energy source because of differences in burner technology, combustion controls, refractory linings, power control panels and fuel-delivery or storage infrastructure.
The model considers two capital cost components: physical asset depreciation and the opportunity cost of capital, represented by interest. The depreciable base is the total capital investment less the anticipated salvage value at the end of the 15-year useful life. Annual straight-line depreciation is calculated over that service life.
Per-kilogram capital carrying cost is calculated by adding hourly depreciation and hourly interest, then dividing the result by the nominal hourly capacity.
The model identifies PNG as requiring the lowest initial investment, at INR 9.8 million, because pipeline supply avoids the high-pressure storage tanks, vaporisers and pressure-regulating infrastructure required for LPG. The LPG furnace investment is INR 107 million, while the electric furnace has the highest capital expenditure at INR 120 million, reflecting the need for heavy-duty transformers, heating elements, thyristor drive panels and specialised insulation systems. The resulting capital charges are INR 0.26/kg for PNG, INR 0.29/kg for LPG and INR 0.32/kg for electric melting.
Fuel and energy efficiency dynamics
Specific energy consumption is a key driver of melting performance. Tower or shaft furnaces can achieve higher thermal efficiency than traditional reverberatory or crucible melters by using counter-current heat exchange: hot exhaust gases rising through the vertical shaft preheat incoming solid aluminium scrap and ingots before they enter the melting zone.
The model places the theoretical sensible and latent heat requirement for raising aluminium from 25°C to a molten state at approximately 0.32 kWh/kg, equivalent to 1.15 MJ/kg or 275 kcal/kg. It assumes industrial tower-furnace thermal efficiency of 50–65%, resulting in higher actual energy inputs.
The furnace’s thermal profile involves solid feedstock entering at the top of the vertical shaft. Ascending flue gas at 800–1,000°C transfers waste heat to the descending charge, preheating it to 350–450°C before it reaches the hearth. Primary burners at the base complete the transition to liquid metal at approximately 720°C.
The specific consumption rates and utility tariffs used in the model are shown below.
|
Energy source |
Specific consumption rate |
Unit tariff |
Direct energy cost |
|
Liquefied petroleum gas (LPG) |
0.048 kg LPG/kg aluminium |
INR 65/kg |
INR 3.12/kg aluminium |
|
Piped natural gas (PNG) |
0.062 standard cubic metres (scm)/kg aluminium |
INR 51.50/scm |
INR 3.19/kg aluminium |
|
Electricity |
0.6 kWh/kg aluminium |
INR 9.00/kWh |
INR 5.40/kg aluminium |
Direct energy costs show a clear difference between combustion and electric resistance heating. LPG has the lowest direct energy cost at INR 3.12/kg, followed by PNG at INR 3.19/kg. Electric melting costs INR 5.40/kg at the assumed industrial grid tariff, a premium of around 73.1% over LPG.
Fixed and variable non-fuel conversion expenses
Beyond fuel and capital charges, aluminium melting incurs costs associated with labour, refractory maintenance, plant space, auxiliary electrical loads, chemical fluxes, dross handling and metallurgical quality control. In this benchmark, these costs are held constant across all three energy options to isolate the impact of energy and capital investment.
|
Cost item |
Basis |
Cost impact |
|
Labour |
Monthly shift-operator and helper allocation divided by monthly output |
INR 0.35/kg |
|
Maintenance and refractory |
Refractory wear, relining cycles and mechanical repairs |
INR 0.25/kg |
|
Insurance |
Annual equipment and property insurance divided by annual output |
INR 0.04/kg |
|
Rent/space allocation |
Foundry footprint rental rate divided by throughput |
INR 0.06/kg |
|
Auxiliary power |
Power for blowers, hydraulic tilt mechanisms and control systems |
INR 0.12/kg |
|
Flux/cover material |
Degassing and cover-flux consumption multiplied by unit price |
INR 0.18/kg |
|
Dross handling and disposal |
Skimming labour, dross-press operation and waste handling |
INR 0.08/kg |
|
Quality testing/spectrometer |
Chemical analysis and testing allocation |
INR 0.03/kg |
|
Total non-fuel operating cost |
Sum of the listed conversion cost items |
INR 1.11/kg |
The benchmark standardises non-fuel operating costs at INR 1.11/kg. In practice, electric furnaces may reduce blower power and extend refractory life by eliminating direct flame impingement. These savings may be offset by periodic replacement of silicon carbide or electric immersion heating elements.
Metal oxidation and the cost of dross loss
Metal oxidation, commonly referred to as dross formation, is the largest individual cost component in this model, exceeding the direct energy cost. At elevated temperatures, aluminium exposed to oxygen forms aluminium oxide (Al₂O₃), alongside entrapped metallic aluminium and trace nitrides. Oxidation is influenced by combustion conditions, bath-surface disturbance, exposure time, furnace geometry and melt temperature. Tower furnaces can mitigate oxidation compared with open reverberatory furnaces through controlled combustion and a sealed vertical shaft.
The model applies a baseline metal-loss rate of 2%, within a stated industrial tower-furnace range of 1.5–3%. Using a P1020 reference price of INR 354.95/kg, the calculated dross cost is INR 7.10/kg: INR 354.95/kg × 2% = INR 7.10/kg.
At this assumed loss rate, dross accounts for approximately 58.4% of the total melting cost for LPG and 48.1% for electric melting.
The model indicates that reducing dross generation by just 0.5 percentage points would save approximately INR 1.77/kg, more than the INR 0.07/kg difference between the direct energy costs of LPG and PNG.
|
Cost element |
LPG furnace |
PNG furnace |
Electric furnace |
|
Dross oxidation loss |
58.39% (INR 7.10/kg) |
58.15% (INR 7.10/kg) |
48.14% (INR 7.10/kg) |
|
Direct fuel/energy input |
25.66% (INR 3.12/kg) |
26.13% (INR 3.19/kg) |
36.61% (INR 5.40/kg) |
|
Non-fuel operating cost |
9.13% (INR 1.11/kg) |
9.09% (INR 1.11/kg) |
7.53% (INR 1.11/kg) |
|
Factory overheads |
4.44% (INR 0.54/kg) |
4.50% (INR 0.55/kg) |
5.56% (INR 0.82/kg) |
|
Capital charge |
2.38% (INR 0.29/kg) |
2.13% (INR 0.26/kg) |
2.16% (INR 0.32/kg) |
Total cost build-up and financial impact
The model aggregates direct energy costs, non-fuel operating expenses and capital charges to establish the subtotal conversion cost. A 12% factory overhead markup is then applied, after which the dross-loss impact is added to calculate the total melting cost.
Subtotal conversion cost = Fuel/energy cost + Non-fuel operating cost + Capital charge.
Cost before dross = Subtotal conversion cost × 1.12.
Total melting cost (INR/kg) = Cost before dross + Dross-loss impact.
|
Cost layer |
LPG model |
PNG model |
Electric model |
|
Fuel/energy cost |
INR 3.12/kg |
INR 3.19/kg |
INR 5.40/kg |
|
Non-fuel operating costs |
INR 1.11/kg |
INR 1.11/kg |
INR 1.11/kg |
|
Capital charge (depreciation + interest) |
INR 0.29/kg |
INR 0.26/kg |
INR 0.32/kg |
|
Subtotal conversion cost |
INR 4.52/kg |
INR 4.57/kg |
INR 6.83/kg |
|
Factory overhead markup |
12% |
12% |
12% |
|
Overhead cost impact |
INR 0.54/kg |
INR 0.55/kg |
INR 0.82/kg |
|
Total cost before dross |
INR 5.06/kg |
INR 5.11/kg |
INR 7.65/kg |
|
Dross-loss impact (2%) |
INR 7.10/kg |
INR 7.10/kg |
INR 7.10/kg |
|
Total melting cost |
INR 12.16/kg |
INR 12.21/kg |
INR 14.75/kg |
|
Total melting cost per tonne |
INR 12,158 |
INR 12,213 |
INR 14,751 |
|
Annual melting expenses (3,000 tonnes) |
INR 3,64,74,867 |
INR 3,66,38,013 |
INR 4,42,53,267 |
|
Annual savings versus electric baseline |
INR 77,78,400 |
INR 76,15,253 |
Baseline |
The model puts LPG at the lowest overall melting cost, at INR 12.16/kg, with annual operating expenditure of INR 3,64,74,867 for an output of 3,000 tonnes. PNG is a close alternative at INR 12.21/kg, with an annual premium of INR 1,63,146 over LPG. Where pipeline connections are available, PNG may therefore be attractive because it avoids LPG storage-yard management and fuel logistics.
Electric melting has a modelled total cost of INR 14.75/kg, a premium of INR 2.59/kg over LPG. At an annual output of 3,000 tonnes, the model estimates a cost penalty of INR 77,78,400 compared with LPG and INR 76,15,253 compared with PNG.
Recommendation
Procurement teams, sourcing leaders and foundry executives should update should-cost models regularly to reflect changes in P1020 primary aluminium prices, local commercial gas prices and regional electricity tariffs. Integrating current commodity indices and utility tariffs can help ensure that supplier-negotiation benchmarks reflect changing cost conditions.
Note: The figures above reproduce the assumptions and outputs stated in the supplied model. Actual costs will vary by furnace design, operating conditions, feedstock mix, energy tariffs and metal-loss performance. Credit for the information used in this article goes to a LinkedIn post by Vikash Arun, Sourcing Manager at Mahindra Group
Grow with
AL Circle