您想继续阅读英文文章还
是切换到中文?
是切换到中文?
THINK ALUMINIUM THINK AL CIRCLE

As of March 20, 2026, the New Delhi-based Worldwide Aluminium Ltd has been downgraded from ‘Sell’ to ‘Strong Sell’, as concerns around its financial position, pricing and market signals continue to build. This reassessment has come even though the company has improved in recent quarters, suggesting that the bigger picture of the downstream aluminium trader still remains uncertain.
{alcircleadd}Explore- Most accurate data to drive business decisions with Global ALuminium Industry Outlook 2026 across the value chain
Financial position of Worldwide Aluminium
In the longer term, the financial figures of Worldwide Aluminium leave much to be desired. Its average Return on Equity (ROE) is around only 1.55 per cent, which is quite low, implying limited returns for shareholders. Growth has also hit a slump, with operating profit rising at barely over 6 per cent annually over the past five years.
Moreover, the company has also evidently faced debt-management pressures. Its average EBIT-to-Interest ratio is at -0.31, implying that its operating earnings are not enough to cover interest payments. This questions the firm’s ability to handle its financial obligations.
On the valuation side, the stock does not reflect profitability either. The stock trades at a price-to-book ratio of 1, which may appear stretched, given its weak earnings and slow growth trajectory. The current price, decreased from the previous close, stands at INR 19.86 (USD 0.21), still below its 52-week high of INR 26.48 (USD 0.28). Over 2025, the stock has fallen by 5.43 per cent, trailing the broader market benchmark.
That said, the company has also reported positive results for five consecutive quarters. In the previous quarter, net sales rose sharply by 66.32 per cent to INR 252.3 million (USD 2.71 million). Profit after tax for the nine-month period also turned positive at INR 900 thousand (USD 9,666.59).
Additionally, World Aluminium’s debtor turnover ratio of 8.14 times suggests that it is collecting payments relatively efficiently.
Don't miss out- Buyers are looking for your products on our B2B platform
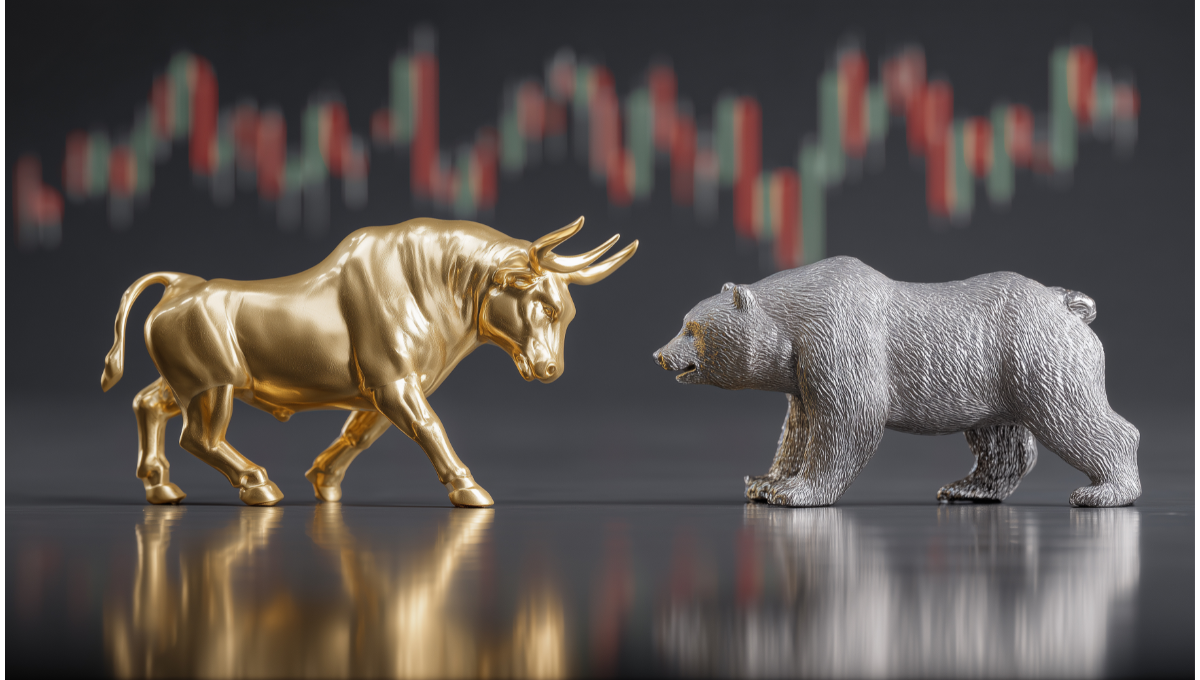
What do the technical indicators say?
However, despite these improvements, technical indicators have not been encouraging. Indicators of Moving Average Convergence Divergence (MACD) and Know Sure Thing (KST) are pointing downward on weekly as well as monthly charts, implying continued pressure on the stock.
Daily averages also suggest a slight downward trend, while other indicators like the Relative Strength Index (RSI) remain neutral, and Bollinger Bands do not give a clear positive signal, maintaining bullish for a weekly and bearish on a monthly timeframe.
Stock performance
Recent trading has contributed to this cautious view. The stock has dropped in the latest session and has been moving within a narrow and quite unstable range, throwing light on weak confidence, discouraging any strong upward movement in the near term.
In terms of performance, the stock has done slightly better than the Sensex over shorter periods, like a week or a month.
However, the scale for the broader angle remains tilted towards the negative, as returns for the year so far and over the past year are both negative. Gains reported over longer periods still fall short of the broader market, drawing up a pattern of underperformance.
Image for referential purposes only
Responses