您想继续阅读英文文章还
是切换到中文?
是切换到中文?
THINK ALUMINIUM THINK AL CIRCLE

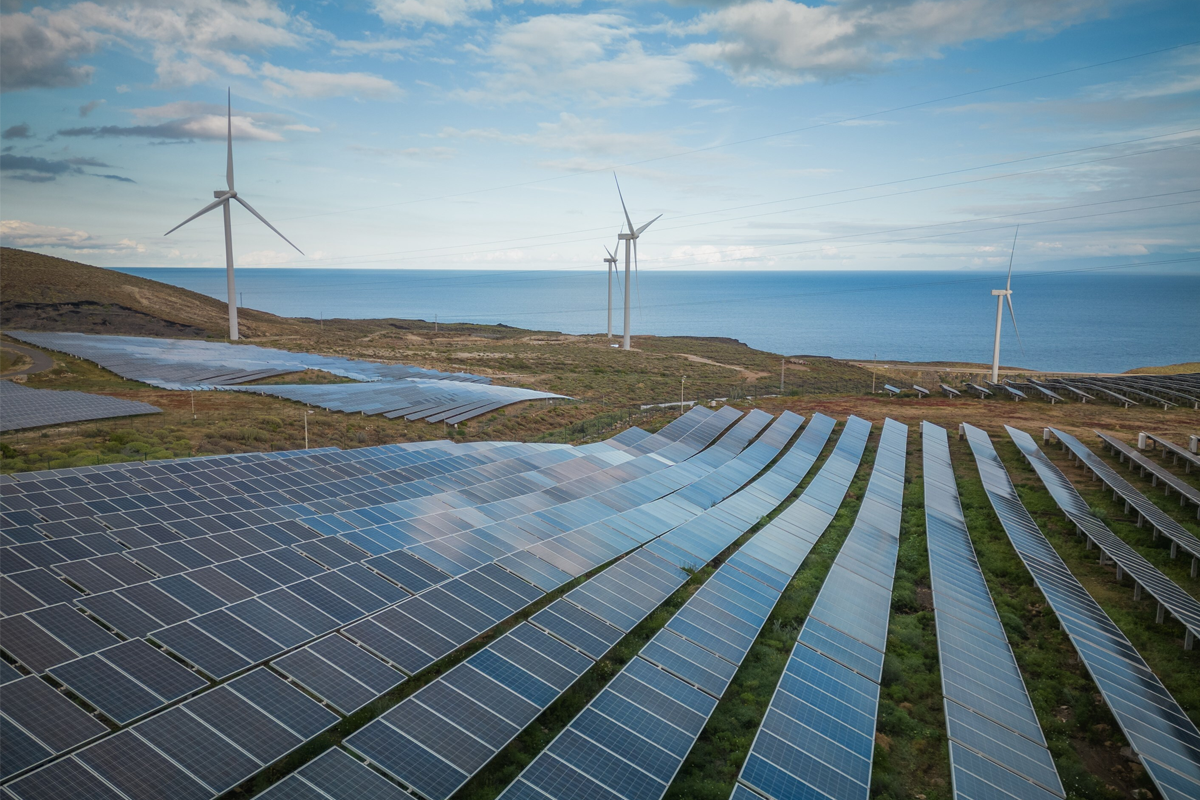
Source: Stock image
Renewable energy is moving from supportive to strategic role as it is set to account for 45 per cent of the global electricity generation. This marks a structural shift in how industries will be powered. China, Europe, the United States, and India are at the centre of this transformation, driven by rapid additions in solar, wind, and hydropower capacity. While these regions lead the clean energy buildout, they also represent some of the world’s most significant aluminium production hubs, where electricity remains the single most critical input cost. So, this calls for an evaluation that how far the clean power surge in these regions is translating into lower-carbon aluminium production across these major regions.
{alcircleadd}Before that assessment, the scale of the renewable buildout itself deserves attention. According to the International Energy Agency, global renewable power capacity is expected to reach 4,600 GW between 2025 and 2030, nearly double the growth recorded in the previous five-year period. Solar power will remain the dominant growth engine, accounting for 80 per cent of new renewable electricity capacity, while onshore wind, offshore wind, and hydropower will continue to provide balance and system support.
Solar energy is winning the race
At the end of 2025, cumulative global solar PV capacity was close to 2,900 GW after an addition of 647 GW of solar capacity. Together solar and wind capacity, new installation reached 814 GW, bringing global installed capacity to 4,174 GW. Individually, new installation of solar capacity grew 11 per cent Y-o-Y, while wind deployment jumped 47 per cent annually, rising from 113 GW to 167 GW. By the end of 2025, global installed wind capacity reached around 1,300 GW.
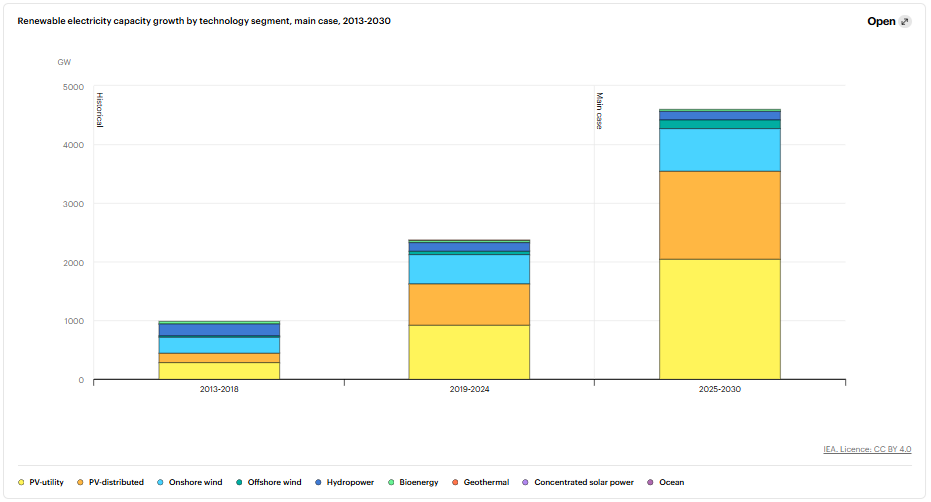
Source: International Energy Agency
Comparing the range of five years since 2013, solar PV-utility and PV-distributed capacity soared by 270 per cent from 438 GW (during 2013-18) to 1,621 GW (2019-24) and is expected to further leap to 3,545 GW, representing a surge of 118 per cent from the previous five-year period. During 2013-18, onshore and offshore wind capacity was at 297 GW, which grew over the next five years by 90 per cent, amounting to 565 GW. IEA projects the cumulative wind capacity to reach 872 GW by 2030, recording an increase of 54 per cent from 2019-2024.
For the global aluminium value-chain 2026 outlook, book our exclusive report “Global ALuminium Industry Outlook 2026"
Country-wise solar installations
…and so much more!
SIGN UP / LOGINResponses