According to the latest US Geological Survey data, the United States in February 2020 exported 236,000 tonnes of aluminium (including scrap), marking a rise of 2.16 per cent from 231,000 tonnes in January. This brought the United States total aluminium exports in the first two months of 2020 to 467,000 tonnes. Mexico, Canada, India, the Republic of Korea, and Malaysia were the top 5 importers of the US aluminium in February.
In February 2020, Mexico imported 50,200 tonnes of aluminium from the US, up 1,000 tonnes or 20.33 per cent from 49,200 tonnes in January. In the previous two months, Mexico imported 89,700 tonnes of aluminium from the US in total. In November, the import amount was 48,800 tonnes, while in December, a 16.19 per cent lesser at 40,900 tonnes. This represents that except for December, Mexico’s aluminium imports from the US saw a month-on-month growth in January and February. Mexico’s total US aluminium imports in the first two months of 2020 came in at 99,400 tonnes.
{alcircleadd}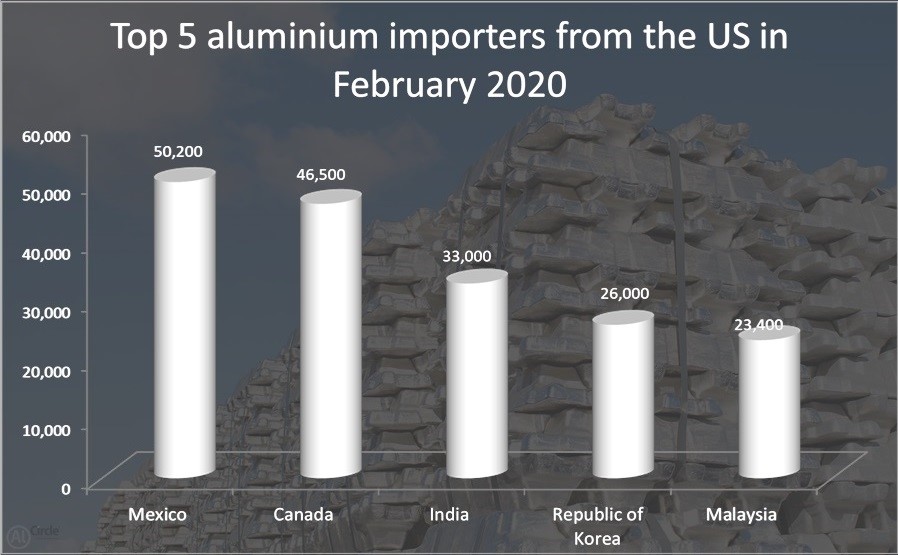
Canada, being the second largest aluminium importer from the US in February 2020, secured 46,500 tonnes, down 7.37 per cent from 50,200 tonnes of aluminium imports by Mexico. In January, Canada imported 46,400 tonnes of aluminium from the US, meaning the country’s imports in February stood flat month-on-month. In November and December 2019, the country had secured 42,700 tonnes and 36,100 tonnes, respectively. This represents that similar to Mexico, Canada’s aluminium imports from the US saw a plunge in December by about 15.45 per cent but rebounded in January. Canada’s total aluminium imports from the US in the first two months of 2020 stood at 92,800, down 7 per cent from Mexico’s total imports in January and February.
India, in February 2020, imported 33,000 tonnes of aluminium from the US, compared to 29,000 tonnes in January. So, in February, India’s aluminium imports from the US saw a rise of 14 per cent month-on-month. The difference between India's aluminium imports and Canada’s aluminium imports from the US in February stood at 41 per cent. In November 2019, India imported 23,600 tonnes of aluminium from the US, which in December grew by 31.35 per cent to 31,000 tonnes. This represents India’s imports in January lowered by 2,000 tonnes or 6.45 per cent month-on-month. India’s total aluminium imports from the US in January and February were 62,000 tonnes.

The Republic of Korea was the fourth leading aluminium importer from the US in February 2020, securing 26,000 tonnes, down 7,000 tonnes, or 27 per cent from India’s imports in the same month. In January 2020, the Republic of Korea imported 24,700 tonnes of aluminium from the US, flat compared to 24,800 tonnes in December 2019. In February, the United States aluminium exports to Korea recorded a growth of 5.26 per cent. In November 2019, the Republic of Korea imported 25,300 tonnes of US aluminium, which represents a decline of 2 per cent in the country’s imports in December. This means the rise in Korea’s aluminium imports from the US in February 2020 came after a month of restraint, followed by a decline. In January and February 2020, the Republic of Korea’s total aluminium imports from the US were 50,700 tonnes.

Malaysia was the fifth leading importer, which hauled 23,400 tonnes of aluminium from the US in February 2020. In January, Malaysia’s imports from the US were 27,500 tonnes, meaning the country in February saw a decline of 15 per cent in its imports. In November and December, Malaysia imported 42,300 tonnes and 35,100 tonnes, respectively, which again represents that Malaysia has been witnessing a downfall in its aluminium imports from the US over the past four months in a row.
Responses