您想继续阅读英文文章还
是切换到中文?
是切换到中文?
THINK ALUMINIUM THINK AL CIRCLE

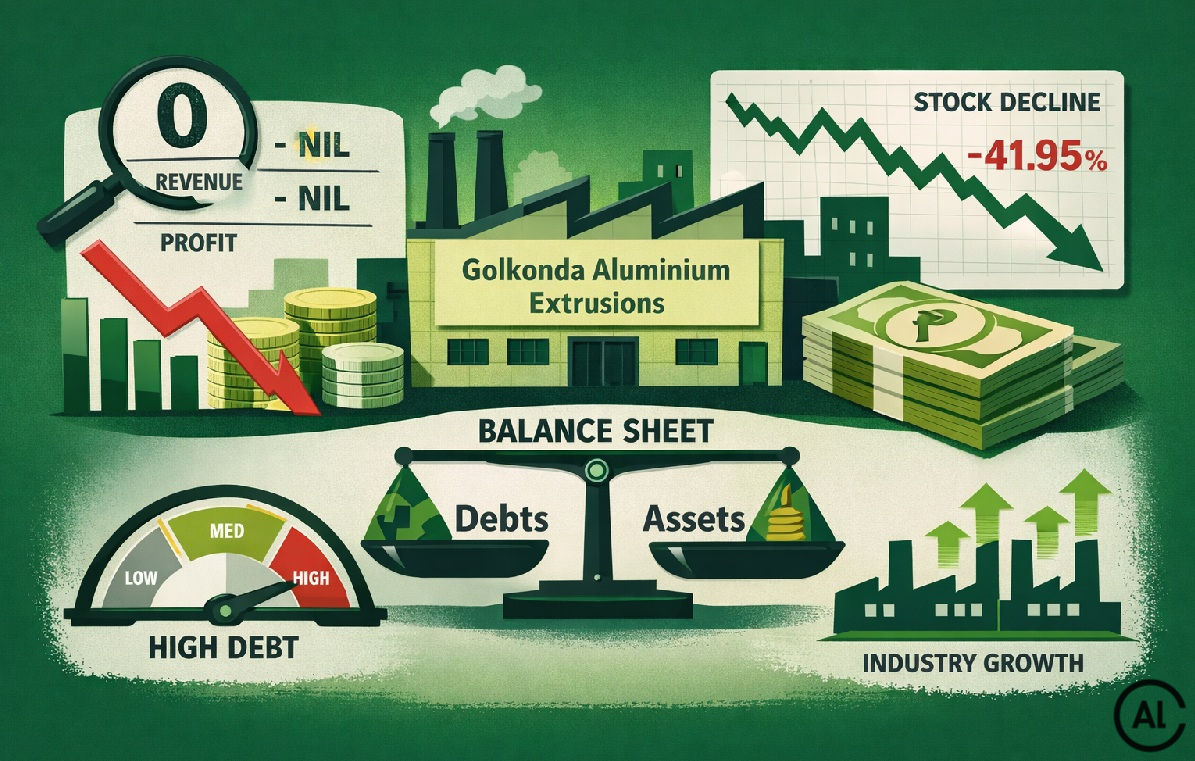
From a distance, Golkonda Aluminium Extrusions’ Q2 FY26 numbers suggest movement but up close, they show how little of it there was. The micro-cap non-ferrous metals company, valued at INR 40 million (USD 0.44 million), reported net sales of INR 1.9 crores (USD 0.2 million) and a net profit of INR 0.5 million (USD 5525). That was an improvement from Q1 FY26, when revenue was nil.
{alcircleadd}The year-on-year comparison only adds to the illusion. Sales were up 280 per cent from INR 0.5 million (USD 5525) in Q2 FY25, but the base was so low that the growth says more about arithmetic than execution. Revenue did reappear sequentially, yet the pattern across quarters remains uneven, with activity flickering on and off rather than building. Profit moved the same way, dropping sharply from INR 1.7 million (USD 18.7 thousand) in Q1 FY26 to INR 0.5 million (USD 5525) in Q2 FY26.
Where the profits came from -and where they went
On paper, the Q2 profit translated into a PAT margin of 26.32 per cent. It highlighted how quickly earnings can thin out. The previous quarter had been supported by other income of INR 1.8 million (USD 19.8 thousand). That line item vanished in Q2 FY26, falling to zero, and the impact showed up immediately in the bottom line.
For 2026 aluminium market outlook, download our report TOC: Global Aluminium Industry Outlook 2026
This reliance on non-operating income fits a longer pattern. For FY25, the company reported net sales of effectively zero, with total expenditure also at nil. The business spent much of the year inactive, which makes the appearance of profit in isolated quarters difficult to read as anything more than temporary.
A balance sheet under strain
The balance sheet offers little comfort. As of March 2025, shareholder funds stood at INR 81.8 million (USD 0.9 million). Current liabilities, meanwhile, had ballooned to INR 25000.3 million (USD 0.27 billion). Against that, current assets were just INR 0.3 million (USD 3315). The gap is so wide that it points either to major restructuring or to accounting outcomes that are hard to reconcile with ongoing operations.
Efficiency metrics follow the same theme. Average return on capital employed stood at -14.99 per cent, pointing to consistent value erosion. Return on equity averaged 0.0 per cent, despite a latest reading of 2.02 per cent, well below what is normally expected from a manufacturing business. Sales to capital employed averaged 0.06x, meaning revenue generation remained negligible relative to the capital base. Fixed assets rose to INR 7.9 million (USD 87 thousand) by March 2025 from nil in earlier years, but that increase has yet to show up in sales.
Five-year sales growth of 5.55 per cent and EBIT growth of 13.09 per cent offer little context given the tiny absolute numbers and the company’s largely dormant state.
Sector gains, company falls behind
The market has treated the stock accordingly. Over the past year, Golkonda Aluminium shares have fallen 41.95 per cent, while the Sensex gained 5.37 per cent and the Non-Ferrous Metals sector surged 65.61 per cent. That leaves a 107.56 per cent point gap versus sector peers. The stock now trades at INR 7.46 (USD 0.08), almost 47.09 per cent below its 52-week high of INR 14.10 (USD 0,16), and at a price-to-book multiple of 0.47x. Technically, the picture has remained weak, with the stock below all key moving averages and stuck in a bearish trend since late January 2026.
Leverage only deepens the concern. Average debt-to-equity stands at 297.62 times. Debt-to-EBITDA has reached 2,500.00 times. Net debt to equity tells the same story. An average EBIT-to-interest coverage ratio of -0.48x shows that operating earnings have not been sufficient to cover interest costs, even though recent quarters have reported zero interest charges, possibly due to restructuring or lender forbearance.
Peer comparisons make the gap harder to ignore. Golkonda’s P/E ratio of 23.12x sits above companies such as Ashoka Metcast and Chennai Ferrous, despite an average ROE of 0.0 per cent. Chennai Ferrous, Krupalu Metals and RR Metalmakers all post double-digit returns, while even Ashoka Metcast’s modest ROE stands well clear.
Don't miss out- Buyers are looking for your products on our B2B platform
Responses