Global aluminium scrap trade trend: US sells, Asia buys
中文翻译附于新闻末尾,敬请继续阅读。
Ever since the emergence of recycled aluminium as a key lever for both decarbonisation and supply security in the industry, the United States (US) has emerged as one of the world’s leading exporters of aluminium scrap, with a well-established collection network and surplus generation. Large volumes of US-origin scrap are shipped to processing hubs in Asia, indicating a strategic supply corridor between the West and the East.
That being said, with the stark demand surge for recycled aluminium across the world, the US has also been weighing the value of the metal, and as advised by the Aluminium Association, looking to treat its “aluminium scrap as a strategic asset.”
Explore- Most accurate data to drive business decisions with Global ALuminium Industry Outlook 2026 across the value chain
It becomes evident as we take a look at the rise in import trend of aluminium scrap between January and June (H1) 2025, which climbed 31 per cent, from 328,000 tonnes to 430,000 tonnes.
However, in the H2 (as of July-November), the US sourced around 263,100 tonnes of the scrap metal. The fall in import trend can be linked to the 50 per cent US tariff imposition on aluminium, resulting in a scaling back of shipping aluminium to the country.
What is the US’ strategy for its aluminium scrap asset?
With a rise in imports, a decline can be noted in the US’ export of aluminium scrap in YTD November, 2025. According to the trade data gathered from the US Geological Survey (USGS) database, while the cumulative amount shipped till November 2024 stood at 1,920,000 tonnes, it settled at 1,880,000 tonnes for the same period in 2025, reflecting a slight difference of 2.08 per cent.
Was the decline steady or drastic? Starting with an upward trend through May, which accounted for 191,000 tonnes of aluminium scrap, a notable dip was observed in June, as it fell to 173,000 tonnes. This development, too, can be attributed to the immediate impact of the 50 per cent tariff imposition on imported primary aluminium, which channelised a drop in exports and prompted a greater use of recycled aluminium in the domestic industries.
Pace was up again in August with the shipment volume rising to 180,000 tonnes, followed by a steady rise till November, the volume for the month amounting to 193,000 tonnes.
The US has planned to protect its domestic aluminium scrap market through a multifaceted strategy comprising a ban on exporting high-grade scrap, particularly Used Beverage Containers (UBCs), implementing a Harmonised Tariff System (HTS) to better differentiate between the types of scrap in order to prevent leakage of valuable, mill-ready aluminium scrap.
The Department of Energy (DOE) is funding projects designed to improve the scrap sorting system to maximise the recovery of high-grade scrap. Additionally, in order to strengthen the aluminium supply chain, domestic recycling is being favoured to boost competitiveness against global opponents such as China.
However, despite the spike in imports and mellowed exports in 2025, the US aluminium export market remains stable, as Asia remains its biggest buyer.
Don't miss out- Buyers are looking for your products on our B2B platform
Asia and its top 5 importers of aluminium scrap
Amongst the 30+ markets that source aluminium scrap from the US, Asia remains firmly positioned as the largest hub for the imported scrap metal. The top five importers of US aluminium scrap are China, India, Malaysia, the Republic of Korea and Thailand, all being Asian countries. Since they have been the top buyers in 2024 as well as 2025, it indicates the consistency of the nations in maintaining stable trade relations with the US, despite the strained phases resulting from the US tariff impositions.
However, a year-on-year (Y-o-Y) decline was noted in the import volumes to India, Malaysia and the Republic of Korea in 2025. The shipment to India fell from 379 thousand tonnes to 361 thousand tonnes, reflecting a 4.75 per cent decrease. Malaysia’s imports dropped 20.9 per cent, sliding from 335 thousand tonnes to 265 thousand tonnes. Similarly, the Republic of Korea sourced 10.28 per cent, the volume slipping from 214 thousand tonnes to 192 thousand tonnes.
Since these dips have occurred in a fairly steady trend, spaced through January to November, it hints at a minor pullback from the US in an attempt to retain its domestic aluminium scrap.
The import decline in these three nations was offset by a sourcing surge in the other two, viz., China and Thailand. China’s imports from the US increased Y-o-Y by 35.75 per cent, jumping from 221 thousand tonnes in 2024 to 300 thousand tonnes in 2025. Likewise, a hike was seen in Thailand’s imports, which rose from 313 thousand tonnes in 2024 to 384 thousand tonnes in 2025, marking an increase of 22.68 per cent.
While China reported a steady month-on-month rise in its imports, Thailand had a more erratic inflow of aluminium scrap in YTD 2025. Trade volume remained steady till May 2025, reaching the all-year high in the month at 45.8 thousand tonnes, which dipped suddenly to 33 thousand tonnes in June, followed by another drastic fall to 22.4 thousand tonnes in July, reflecting an average M-o-M decline of approximately 30 per cent.
Stella Ying Wang, Senior Trading Manager at American Iron & Metal Recycling, noted that the drastic dip in June and July was related to a sudden halt in recycling operations since “late May” due to “inspections related to illegal waste dumping.” She added,“The goal is to prevent Thailand from becoming a global dumping ground for recyclable or hazardous materials.”
This trend recovered at a steady pace throughout the rest of the months, with the November shipment accounting for 44.3 thousand tonnes. Thus, the majority of H1 2025 kept 2025 ahead of 2024 in the aluminium scrap import scorecard.
Must read: Key industry individuals share their thoughts on the trending topics
Demand surge for secondary aluminium in China and Thailand: Why?
China’s steady increase in scrap imports was driven primarily by high demand for and stockpiling of secondary aluminium and a shift toward sustainable, low-carbon production and domestic scrap shortages amid falling primary aluminium prices.
Secondary aluminium consumption in China climbed from 12.70 million tonnes in 2024 to 13.35 million tonnes in 2025, marking a Y-o-Y growth of 5.1 per cent. It was further fuelled by primary production caps, bauxite shortages, and incentives for recycled low-carbon aluminium.
Thailand has ramped up aluminium scrap imports due to booming secondary aluminium production for its electronics and automotive sectors. Thailand’s electrical and electronics production value rose to USD 97.94 billion, marking a 6.23 per cent rise Y-o-Y. Domestic vehicle sales, amounting to 75,121 units as of December 2025, highlighted a Y-o-Y growth of 39 per cent.
This was reinforced by new processing plants and investments from Chinese and Japanese firms relocating amid US-China trade tensions and China's stricter import rules.
The country acts as a regional hub, importing raw aluminium scrap, processing it into high-purity ingots or alloys, and exporting that back to China, Taiwan and South Korea, leveraging 95 per cent lower energy costs. These fuelled the demand surge, despite the later regulatory scrutiny.
While the US considers safeguarding a strategic asset like aluminium scrap, Asia keeps filling its bucket from the US and Europe, becoming the largest collector of aluminium scrap in the global market, resilient amid policy changes or geopolitical pressures, and an impending supply crunch rising from the demand surge.
Trading aluminium across borders? Find out the exact cost you need to bear for the embedded carbon in the product by using this CBAM calculator.
全球废铝贸易新格局:美国出货,亚洲扫货
随着再生铝成为行业脱碳与供应链安全的关键抓手,美国凭借成熟的回收网络和富余产能,一跃成为全球最大的废铝出口国之一。大量美国产废铝运往亚洲加工枢纽,构筑起一条横跨东西方的战略供应通道。
在全球再生铝需求大幅攀升的背景下,美国也愈发重视铝废料的价值。据美国铝业协会建议,美国正将铝废料视作一项战略资源加以对待。
这一转变在进出口数据中体现得尤为明显。2025年1月至6月,美国废铝进口量攀升31%,从32.8万吨增至43万吨。然而,下半年(截至11月)进口量回落至约26.31万吨,这一下降与美国征收50%铝产品关税直接相关,导致输美铝产品减少。
美国如何布局废铝“战略资产”?
2025 年截至 11 月,美国铝废料出口量较上年同期有所下降。美国地质调查局(USGS)数据显示,2024 年同期累计出口量为 192 万吨,2025 年同期为 188 万吨,同比小幅下降 2.08%。
这一下降趋势并非一蹴而就。5月出口量一度冲高至19.1万吨,但6月便骤降至17.3万吨。这同样归因于美国对进口原铝征收50%关税的即时效应——出口减少,而国内工业部门对再生铝的使用量则随之增加。8月出口量回升至18万吨,此后逐月稳步上升,11月达19.3万吨。
为保护本土废铝市场,美国祭出多管齐下的策略:禁止出口高品位废铝,特别是废旧饮料罐;实施统一关税表(HTS)以细化废铝品类,防止高品级、可直接用于轧制的废铝外流;能源部则出资支持项目,改进废铝分选系统,以最大限度回收高品位废料。此外,为强化本土铝供应链,美国正倾向于推动国内回收利用,以提升与全球对手(尤其是中国)的竞争力。
尽管2025年进口激增、出口趋缓,美国废铝出口市场整体仍保持稳定——亚洲依然是其最大买家。
亚洲五强:谁在大量进口美国废铝?
在从美国进口废铝的30多个市场中,亚洲稳坐头把交椅。前五大进口国依次为中国、印度、马来西亚、韩国和泰国,清一色为亚洲国家。2024年和2025年,这五国始终占据进口前列,显示出尽管美国加征关税带来波折,它们与美国仍保持着稳固的贸易关系。
不过,2025年印度、马来西亚和韩国的进口量同比出现下滑。其中,印度从37.9万吨降至36.1万吨,减少4.75%;马来西亚从33.5万吨降至26.5万吨,降幅达20.9%;韩国从21.4万吨降至19.2万吨,下滑10.28%。由于这些下降趋势平稳,且分散在1月至11月期间,这或暗示美国为留存国内废铝资源,略微收紧了出口。
上述三国的进口减少,被中国和泰国进口量的激增所抵消。中国从美国进口量同比增长35.75%,从2024年的22.1万吨跃升至2025年的30万吨;泰国进口量则从31.3万吨增至38.4万吨,增幅达22.68%。
中国进口量呈逐月稳步增长态势,而泰国的进口则波动较大。2025年前5个月进口量平稳上升,5月达到全年高点4.58万吨,6月骤降至3.3万吨,7月进一步跌至2.24万吨,环比平均降幅约30%。
美国金属回收公司高级贸易经理Stella Ying Wang指出,6、7月份的大幅下跌与“5月下旬”因“非法倾倒废物检查”导致回收业务突然停滞有关。她表示:“此举旨在防止泰国成为全球可回收或有害材料的倾倒场。”此后,进口量逐月稳步恢复,11月出货量达4.43万吨。总体而言,2025年上半年大部分时间的强劲表现,使得全年废铝进口量超过了2024年。
中、泰两国再生铝需求为何激增?
中国废铝进口稳步增长,主要驱动力来自:对再生铝的需求旺盛及企业积极备货;向可持续、低碳生产转型;以及在原铝价格下跌背景下,国内废铝供应出现短缺。2025年,中国再生铝消费量从2024年的1270万吨增至1335万吨,同比增长5.1%。原铝产能管控、铝土矿供应偏紧以及低碳再生铝政策激励,进一步推高了需求。
泰国则因电子和汽车行业的再生铝生产蓬勃发展,大幅增加了废铝进口。2025年,泰国电气电子产品产值达979.4亿美元,同比增长6.23%;截至12月,国内汽车销量达7.51万辆,同比大增39%。中美贸易摩擦和中国更严格的进口规则,促使中国和日本企业转移产能,在泰国投资新建加工厂,进一步强化了这一趋势。
泰国作为区域加工枢纽,进口废铝原料,加工成高纯度铝锭或合金,再出口至中国、台湾地区和韩国,其能源成本比周边低95%。这些因素共同推动了泰国废铝需求的激增,尽管后期面临更严格的监管审查。
在美国考虑如何守护废铝这一“战略资产”的同时,亚洲正持续从美国和欧洲吸纳货源,成为全球废铝市场最大的“蓄水池”,在政策变动与地缘压力之下,展现出强大韧性,应对需求激增所带来的供应紧张。

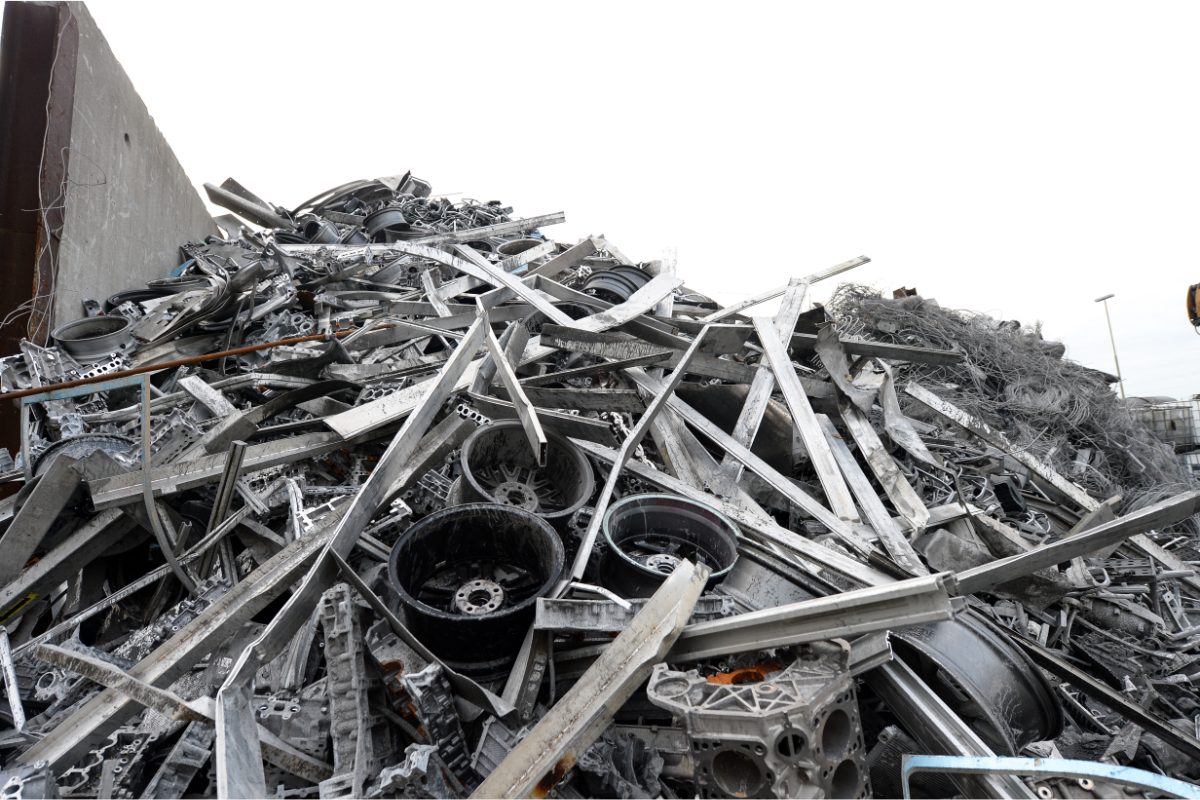
Image for referential purposes only.
Unlock full access – sign up for FREE.
Key benefits
PPG highlights aluminium can recycling urgency with students on World Recycling Day
Next articleFrom tightening scrap flows to renewable power deals, aluminium’s transition moves beyond recycling into a broader structural shift
Grow with
AL Circle









_md.webp)