The discussion considering the durability and lightweight of the most traded metals, that is, aluminium and steel, has been ongoing for years and is never-ending, but how is the current trade policy shaping the trade of these metals in 2025? With a 50 per cent steep tariff imposed by Trump, will these metals have broader trajectories to unfold trade dynamics in the coming years.
To date, both aluminium and steel have their own unique trading dynamics, influenced by the volume and ways they are used, their pricing systems, and the global supply chains. Steel trade thrives on its strength and durability, making it a go-to choice for infrastructure projects, while aluminium is becoming increasingly popular due to its lightweight properties, especially in the automotive and aerospace industries. Here’s their market size and trade: In 2024, the market size of aluminium was between USD 189.3 billion and USD 249.83 billion, while the market size of steel was USD 1.47 trillion (approx.). Their trade values were USD 490.45 billion and USD 918.84 billion, respectively.
A decade in aluminium trade: 2014–2024
Back in 2014, aluminium trade value was at USD 341.42 billion, but it dipped in the following years to USD 322.79 billion in 2015 and USD 307.04 billion in 2016. However, things started to pick up again in 2017, reaching USD 346.72 billion and continued to rise to USD 389.01 billion in 2018.
It then eased back to USD 354.32 billion in 2019 and dropped to USD 329.07 billion in the challenging year of 2020 due to the pandemic. A strong recovery took place in 2021, hitting USD 472.44 billion and the momentum carried on into 2022, peaking at USD 556.56 billion for the decade. After that, values began to moderate, falling to USD 476.37 billion in 2023 and stabilising at USD 490.45 billion in 2024, suggesting a more balanced trade environment.
A decade in the steel trade: 2014–2024
Back in 2014, the global steel trade was worth a whopping USD 834.36 billion, but then it took a nosedive in 2015 and 2016, dropping to USD 671.94 billion and USD 612.61 billion, respectively. Things started to pick up again in 2017, reaching USD 757.65 billion and even hitting a high of USD 863.93 billion in 2018 before softening to USD 763.77 billion in 2019.
2020 brought another decline due to the pandemic, down to USD 667.65 billion, but then we saw a strong rebound, with trade skyrocketing to USD 1,114.29 billion in 2021 and USD 1,162.70 billion in 2022. However, the momentum slowed down in 2023 to USD 983.33 billion and dipped again in 2024 to USD 918.84 billion, indicating a shift in global steel demand.
2025 US tariff - a mirror to 2018 tariff or a wide gameplay?
In June 2025, Trump made a bold move by doubling the US tariffs on aluminium and steel from all trade partners, pushing them up to 50 per cent from the initial 25 per cent. The increase was initiated to tackle market distortions caused by subsidised metals flooding into the United States, particularly from China.
This decision came on the heels of earlier tariffs imposed in 2018 and is rooted in Section 232 of the Trade Expansion Act of 1962, which justifies these levies as a matter of national security. The only difference is - back in 2018, the tariff rates on aluminium and steel were 10 per cent and 25 per cent, while in 2024, the tariff rates are 50 per cent flat. This shift indicates a bolder trade approach designed to protect domestic producers from global overcapacity, simplify tariff enforcement and create a fairer environment for the US manufacturers in both sectors. For industries that rely on these metals, this change will affect supply chain costs, sourcing choices and long-term strategies.
Why the difference between 2018 and 2025?
Between 2018 and 2021, the average US aluminium import value stood at USD 15.33 billion, reflecting the impact of the tariffs imposed by the Trump administration on aluminium and steel back in 2018. However, in the subsequent period spanning 2021, 2022, 2023 and 2024, the average import value surged to USD 19.32 billion.
Similarly, between 2018 and 2021, the average US steel import value stood at USD 25.76 billion. In the subsequent period of 2021–2024, the average import value rose sharply to USD 35.30 billion, following the withdrawal of tariffs under the Joe Biden administration. This could be a reason behind Trump to impose the 50 per cent tariff and secure and uphold the domestic producers.
Which aluminium and steel partners are impacted?
Below listed are some of the major trade partners of the United States. Let’s see how are their aluminium and steel exports are affected by the United States this year’s tariffs.
Considering the ongoing tariff war between the US and Canada, the US imports of aluminium have been reflecting a slight dip. The 2025 year to date shows the import volume to be at 1.5 million tonnes, appraising at USD 4.7 billion. During the same timeframe, the prior year, the volume was recorded at 1.8 million tonnes, estimating the total to be USD 5.5 billion. On the steel front, the US imports from Canada stood at 2.8 million tonnes, standing at USD 3.2 billion. In the previous year at the same time, the import volume was seen to be at 3.6 million tonnes valuing at USD 4.5 billion.
The US tariffs have severely impacted the imports of aluminium and steel from China, reflecting a serious downward trend. Till July 2025, the imports of aluminium and its products by the US from China were recorded at 61 thousand tonnes which valued at USD 232.4 million. In the same timeline, the year before, the import volume was 147 thousand tonnes worth USD 493 million. On the steel front, the import of steel and products by the US from China in 2025 year to date volume stood at 259 thousand tonnes and is valued at USD 403.2 million. In the same timeline, the previous year, the import was recorded at 293 thousand tonnes, whose value was USD 493 million.
The US imports of aluminium from Mexico also witnessed a downward trend, with the imports till July 2025 standing at 31 thousand tonnes, settling at USD 162 million. The year prior, till July, the import volume was recorded to be at 41thousand tonnes, where the value stood at USD 199 million. Considering the steel imports, the US imported a total of 1.8 million tonnes of aluminium from Mexico till July 2025, valued at USD 1.6 billion. The same as in the previous was seen at 1.9 million tonnes, which was valued at USD 2.2 billion.
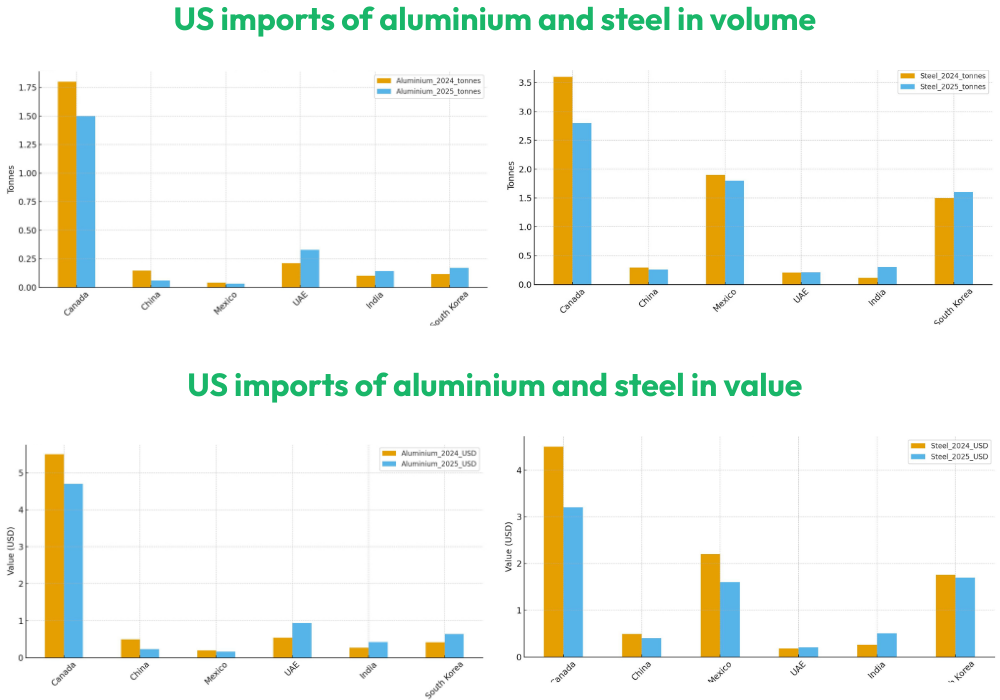
A sharp increase has been witnessed in the imports of aluminium by the US from the United Arab Emirates (UAE) in the first seven months of 2025 as imports inched up to 328 thousand, valued at USD 936 million. In the first seven months of 2024, the imports were 211 thousand tonnes and were valued at USD 542.5 million. A similar trend is seen in the US steel imports as well, where, till July 2025, the imports were 210 thousand tonnes and valued at USD 202 million. In the year before, the imports were measured at 209 thousand tonnes, valued at USD 185.3 million.
Irrespective of Trump elevating the tariff on aluminium and steel from 25 per cent to 50 per cent, the US imports of aluminium and steel from India rose significantly. Year to date, the US imports of aluminium and related products from India stood at 143 thousand tonnes, which totals to USD 425.3 million. In the same period of the previous year, the import stood at 102 thousand tonnes, with a value of USD 273 million. On the other hand, the steel and its related product imports from India stood at 304 thousand tonnes, which totalled at USD 506 million. In the same time frame the previous year, the US imports of steel stood at 115 thousand tonnes, with a value of USD 256.9 million.
Amidst the tariff turbulence, the US imports of aluminium from South Korea significantly increased, where till July 2025 the volume stood at 170 thousand tonnes, which in the previous year at the same time was seen to be at 116 thousand tonnes, each valuing at USD 639 million and 413 million respectively. Considering the steel imports, a similar trend is witnessed as the US imports in 2025 till July stood at 1.6 million tonnes, which in the prior year was at 1.5 million tonnes. However, in terms of value, a slight decline has been observed, where each of the imports stood at USD 1.7 billion and 1.76 billion, respectively.
So, who is impacted most, aluminium or steel?
As per the BCG report, the aluminium industry is experiencing a price shock compared to steel due to the new 50 per cent US tariffs. From early February to late May, aluminium prices in the US surged about 139 per cent compared to European benchmarks, while steel prices also rose, but by a smaller margin of around 77 per cent during the same timeframe.
Although the surge in aluminium is deemed to be severe than that of steel, given steel's trade value and volume from major countries mentioned above, an inch increase in its price could seriously affect the global manufacturers and suppliers.
Note: To feature your brand and share insights, contribute an article or interview in our forthcoming e-magazine "Sustainability & Recycling: Aluminium's Dual Commitment"










_md.webp)
_md.webp)
_md.webp)