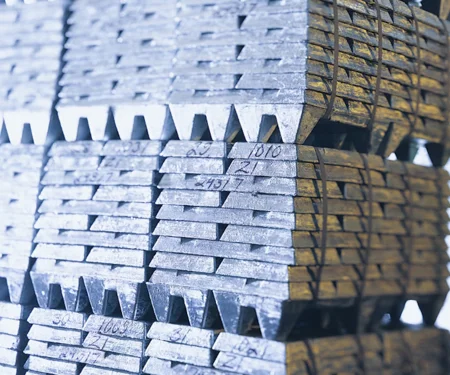
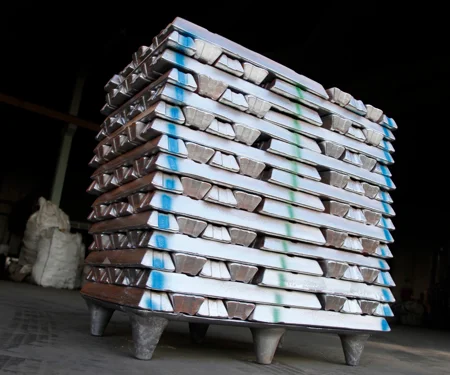
Glass, plastic or aluminium? 74.8% recycling rate gives beverage cans a circularity advantage

The images used in this article are generated with an AI tool and does not depict any real-time moment
A cold beer in a glass bottle, sparkling water in a PET bottle and an energy drink in a sleek aluminium can may occupy the same refrigerator shelf. From a sustainability standpoint, however, they are playing three very different games.
The global beverage packaging industry expands while simultaneously being pushed towards lower carbon emissions, higher recycled content and better packaging circularity. Estimates compiled for this analysis place the broader global beverage packaging market at USD 157.7 billion in 2023, with the market projected to reach USD 222.1 billion by 2030 at a compound annual growth rate (CAGR) of 5 per cent. Alternative methodologies put the market at USD 184 billion in 2025 and USD 283.7 billion by 2034.
Whichever methodology is used, one thing is clear that there will be considerably more beverage packaging moving through the global economy over the coming decade.
The harder question is what it should be made of.
Plastic owns scale, but the packaging map is changing
There is no universally comparable market-share dataset covering only aluminium, glass and PET beverage containers because market studies use different definitions — some measure revenue, others units, and some include cartons and other packaging materials.
Even so, available research establishes plastic as the largest single substrate. Depending on the market methodology, plastic/PET represents roughly 31 per cent to 41.3 per cent of global beverage packaging revenue. PET's appeal is hardly mysterious. It is lightweight, transparent, shatter-resistant, cheap to transport and exceptionally well suited to bottled water, soft drinks and other high-volume, on-the-go beverages.
Thus, global consumption surpassed 520 billion plastic beverage bottles in 2024, up around 6.8 per cent from 487 billion units in 2022, according to industry researchers. PET represented more than 68 per cent of units, while PE accounted for approximately 14 per cent and PP another 8 per cent.
The global beverage plastic bottle market is estimated at approximately USD 256.2 billion in 2026 and forecast to reach USD 444 billion by 2035, translating into a 6.3 per cent CAGR.
But plastic's growth story increasingly comes with an asterisk. Regulators and beverage companies have to figure out what happens to hundreds of billions of bottles after consumers finish drinking from them.
Glass still commands the premium shelf
Glass occupies a different part of the sustainable beverage packaging conversation.
Its strengths are well established with chemical inertness, excellent barrier properties, transparency, brand premiumisation and recyclability. Those characteristics explain why glass remains entrenched in wine, spirits, beer and premium beverages.
The research supplied for this analysis estimates the dedicated glass packaging industry at approximately USD 62.8 billion in 2025, potentially reaching USD 97.5 billion by 2035, representing a CAGR of around 4.5 per cent. Alcoholic beverages account for approximately 42 per cent of glass packaging demand.
Glass is heavy. It requires high-temperature furnaces to manufacture, and a truck transporting glass bottles is also transporting considerably more packaging mass than one carrying an equivalent beverage volume in lightweight containers.
Reviewed research indicates that a glass container can weigh up to ten times more than an equivalent functional PET container. And that weight follows the bottle through the supply chain.
To learn the future of aluminium in the packaging industry, explore our report "ALuminium in Packaging: Consumer Trends and Market Dynamics"
Then comes aluminium
The aluminium beverage can occupies an interesting middle ground. Like glass, primary aluminium is energy-intensive to manufacture. Like PET, however, an aluminium can is lightweight and extremely efficient to transport. Unlike PET, aluminium does not suffer the same polymer degradation issues when repeatedly recycled.
The global aluminium beverage cans market generated approximately USD 43.81 billion in revenue in 2025 and is projected to reach USD 67.28 billion by 2033, representing a 5.5 per cent CAGR, according to research.
More strikingly, aluminium represented approximately 96 per cent of global beverage-can revenue in 2025. The wider aluminium cans market, which extends beyond beverages, has also been estimated at USD 51.33 billion in 2023 and is projected to reach USD 79.33 billion by 2030, growing at a CAGR of 6.4 per cent.
For the aluminium value chain, beverages are consequently much more than a packaging niche. They represent a sizeable downstream market increasingly aligned with the global push towards circular economy packaging.
Additionally, the recyclability percentage of 74.8 vs 47 vs 41.9 is where aluminium pulls ahead. If theoretical recyclability were the only criterion, the glass-plastic-aluminium debate would be fairly straightforward. But a package being technically recyclable does not mean it is actually recycled.
A 2025 global study commissioned by the International Aluminium Institute and conducted by Eunomia compared recycling performance across aluminium beverage cans, PET bottles and glass bottles. The dataset covered approximately 90 per cent of the global aluminium beverage can market, 88 per cent of the PET bottle market and 84 per cent of the glass bottle market.

Aluminium's USD-per-tonne advantage matters too
There is another reason aluminium behaves differently in waste systems as scrap aluminium has economic value. Waste collection ultimately has to be financed. When discarded packaging itself has meaningful commodity value, an economic incentive exists to collect, sort and remelt it.
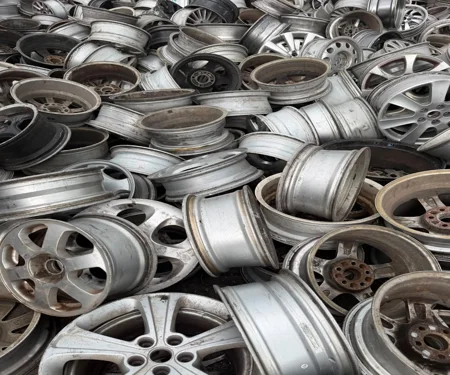
Aluminium scrap feeds directly back into a global secondary aluminium industry supplying automotive, construction, packaging and numerous other applications.
Most importantly, recycled aluminium requires around 95 per cent less energy than producing new aluminium from primary raw materials, according to the Aluminum Association.
Virgin aluminium begins life with a disadvantage because bauxite mining, alumina refining and electrolytic aluminium smelting are energy-intensive processes.
But an aluminium can does not have to return as virgin aluminium. Once the metal enters a well-functioning recycling loop, its energy requirement falls dramatically.
Explore downstream aluminium suppliers, product listings and trade opportunities on AL Biz
But PET has an inconvenient advantage: logistics
A pro-aluminium sustainability argument still has to acknowledge where plastic performs exceptionally well.
PET bottles can be transported to beverage plants as compact preforms and blow-moulded at or close to the filling operation. That means trucks can carry enormous numbers of future bottles without transporting containers largely filled with air.
Empty aluminium cans and glass bottles, by contrast, are normally transported as already formed containers.
PET's low mass also cuts transportation emissions. Consequently, lifecycle studies can show single-use PET performing strongly on carbon footprint, particularly when compared with virgin-material aluminium or heavy single-use glass.
North American water and carbonated soft-drink lifecycle assessments in which 16.9-ounce single-use PET bottles generated 74 per cent lower global warming potential, 80 per cent less solid waste and consumed 53 per cent less water during production than equivalent single-serve aluminium cans and glass bottles.
Aluminium wins strongly on circularity and recycling performance; PET can win on initial material and logistical efficiency.
Glass can beat both, but there is a catch
A single-use glass bottle carries substantial manufacturing and transportation impacts. A bottle reused 20 or 30 times is an entirely different environmental proposition.
An analysis of 32 global lifecycle assessments cited in recent research notes that reusable glass systems can produce up to 85 per cent lower greenhouse gas emissions than single-use glass, 75 per cent lower than single-use PET and 57 per cent lower than single-use aluminium cans, provided sufficiently high rotation rates and efficient local logistics are achieved.
Refillable glass generally reaches carbon parity with single-use glass after roughly two to three rotations. To outperform PET or aluminium, however, it may require approximately 10 to 15 complete rotations.
Beer bottles can target 20-40 rotations, while refillable mineral-water bottles can target around 20–30.
They must be collected, transported, inspected, washed, sanitised and redistributed. If return rates deteriorate or transportation distances become excessive, the environmental advantage shrinks.
The analysis is that reverse-logistics distances beyond roughly 500-1,000 km can eliminate much of the benefit because heavy empty bottles are being transported back to washing and refilling plants.
Brussels is making packaging circularity a balance-sheet issue
Under existing EU single-use plastics legislation, PET beverage bottles must contain at least 25 per cent recycled plastic from 2025, while beverage bottles more broadly must contain at least 30 per cent recycled plastic from 2030.
Europe's broader Packaging and Packaging Waste Regulation (PPWR) further tightens the circularity framework.
Deposit Return Systems are particularly important for aluminium and PET because high collection rates create cleaner material streams and increase the probability that beverage containers actually return to recycling facilities.
Plastic producers need increasingly sophisticated recycling infrastructure to satisfy recycled-content requirements. Glass manufacturers need higher cullet use, lightweighting and efficient reuse networks. Aluminium producers need to decarbonise primary metal while maximising recycled content and can-to-can recovery.
Unlock key insights from industry experts on aluminium's applications in end-use with our magazine
So, which beverage packaging material is actually the most sustainable?
There is no scientifically defensible answer without specifying the system. For lightweight, long-distance distribution where collection infrastructure is weak, PET can offer significant transportation and manufacturing advantages. On the other hand, for premium beverages operating within highly localised deposit-return and refill networks, reusable glass can achieve extremely strong lifecycle performance.
But when the question changes from "Which container has the lowest initial manufacturing footprint?" to "Which single-use beverage container functions most effectively within a circular material economy?", aluminium has a powerful advantage.

The 74.8 per cent global recycling rate for aluminium beverage cans, compared with 47 per cent for PET and 41.9 per cent for glass, is particularly telling.
Add the energy saving from recycling aluminium instead of producing primary metal, and the business case becomes difficult to dismiss.
Also, PET recycling has to manage polymer degradation and contamination. Glass can be repeatedly recycled but carries a substantial weight and melting-energy penalty. Aluminium can be repeatedly remelted while retaining the fundamental properties required of the metal.
Note: This is exclusive coverage by AL Circle and may not be reproduced, republished or shared without prior permission.
Ford's July sales fall as aluminium shortage continues to limit F-Series production
Next articleHydro and General Motors give old aluminium a new life in the new Cadillac EV safety system
Grow with
AL Circle